Topn vlan traffic list, Flux distribute in interface – H3C Technologies H3C Intelligent Management Center User Manual
Page 99
89
To view this chart for an individual interface, click the bar in the Flux Distribute In Interface graph for the
interface for which you want to view this report. For more information about the Flux Distribute In Interface
report, see "
."
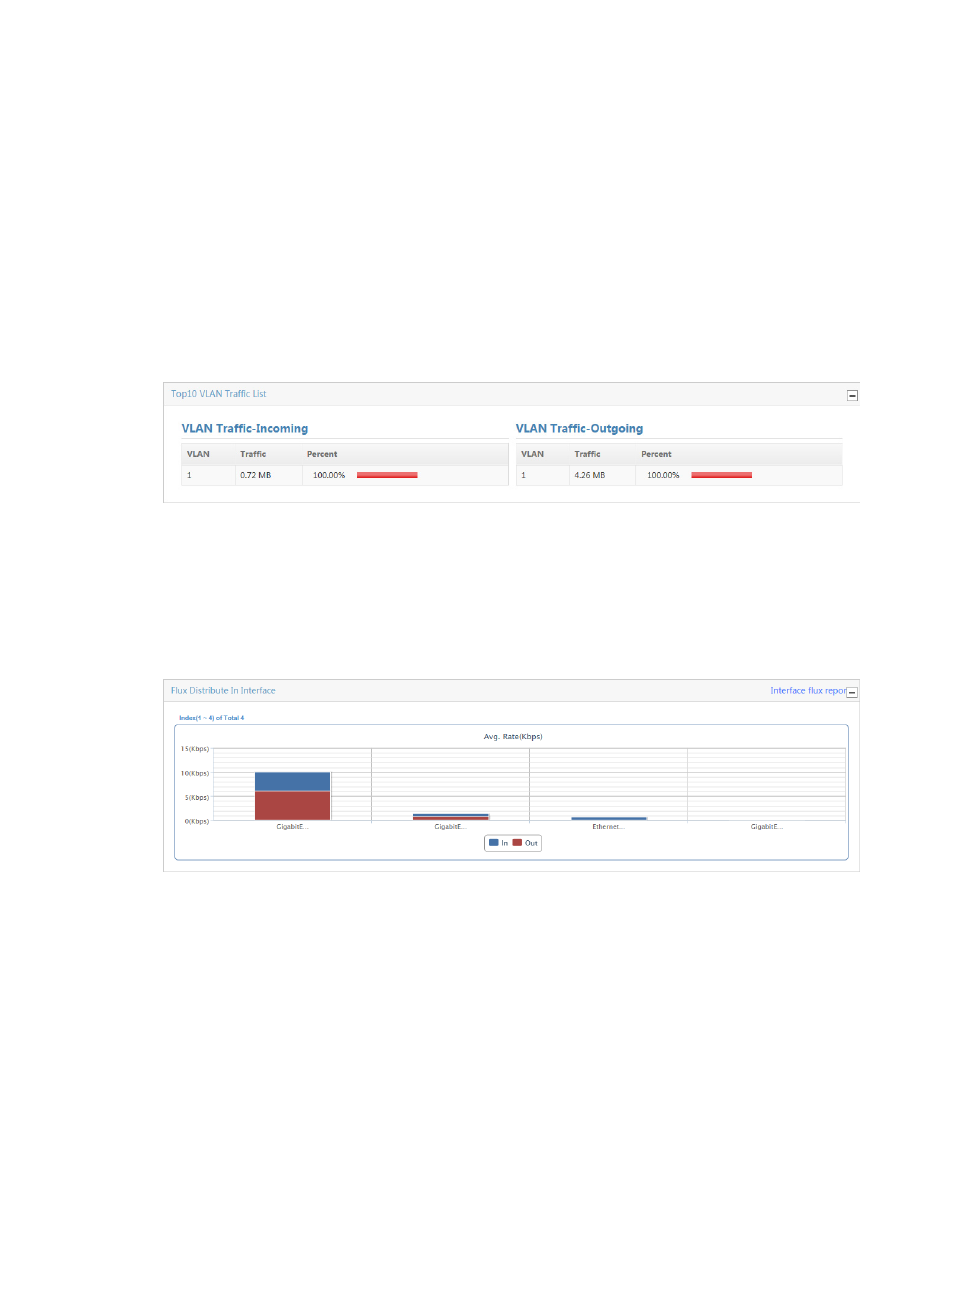
TopN VLAN traffic list
The TopN VLAN Traffic List provides the VLAN Traffic-Incoming and VLAN Traffic-Outgoing charts.
The VLAN Traffic-Incoming chart displays the TopN VLAN traffic received on all interfaces in the traffic
analysis task. The chart displays the VLAN ID, Traffic, and Percent.
The VLAN Traffic-Outgoing chart displays the TopN VLAN traffic sent out all interfaces in the traffic
analysis task. The chart displays the VLAN ID, Traffic, and Percent.
Figure 13 Traffic Report: TopN VLAN Traffic List
Flux distribute in interface
If the task you selected has multiple interfaces configured for it, the Flux Distribute In Interface stacked
bar chart displays the average rate of both inbound and outbound traffic for every interface configured
in the task for the selected time range. The bars in the graph link to the reports for the selected interface.
Figure 14 Traffic Report: Flux Distribute In Interface
This chart is displayed only when the selected task has more than one interface selected.
To view the interface flux report for each interface for the selected time range, click Interface flux report
at the upper right corner of the Flux Distribute In Interface window. The line chart for each interface
displays the inbound and outbound traffic. The line chart for each interface also provides total traffic,
maximum average rate, minimum average rate, average rate, and link utilization in a tabular format.