Flux distribution, Inter-business reports, Query traffic – H3C Technologies H3C Intelligent Management Center User Manual
Page 335
325
For more information on enabling Peak Traffic Analysis, see "
Configuring NTA traffic analysis
."
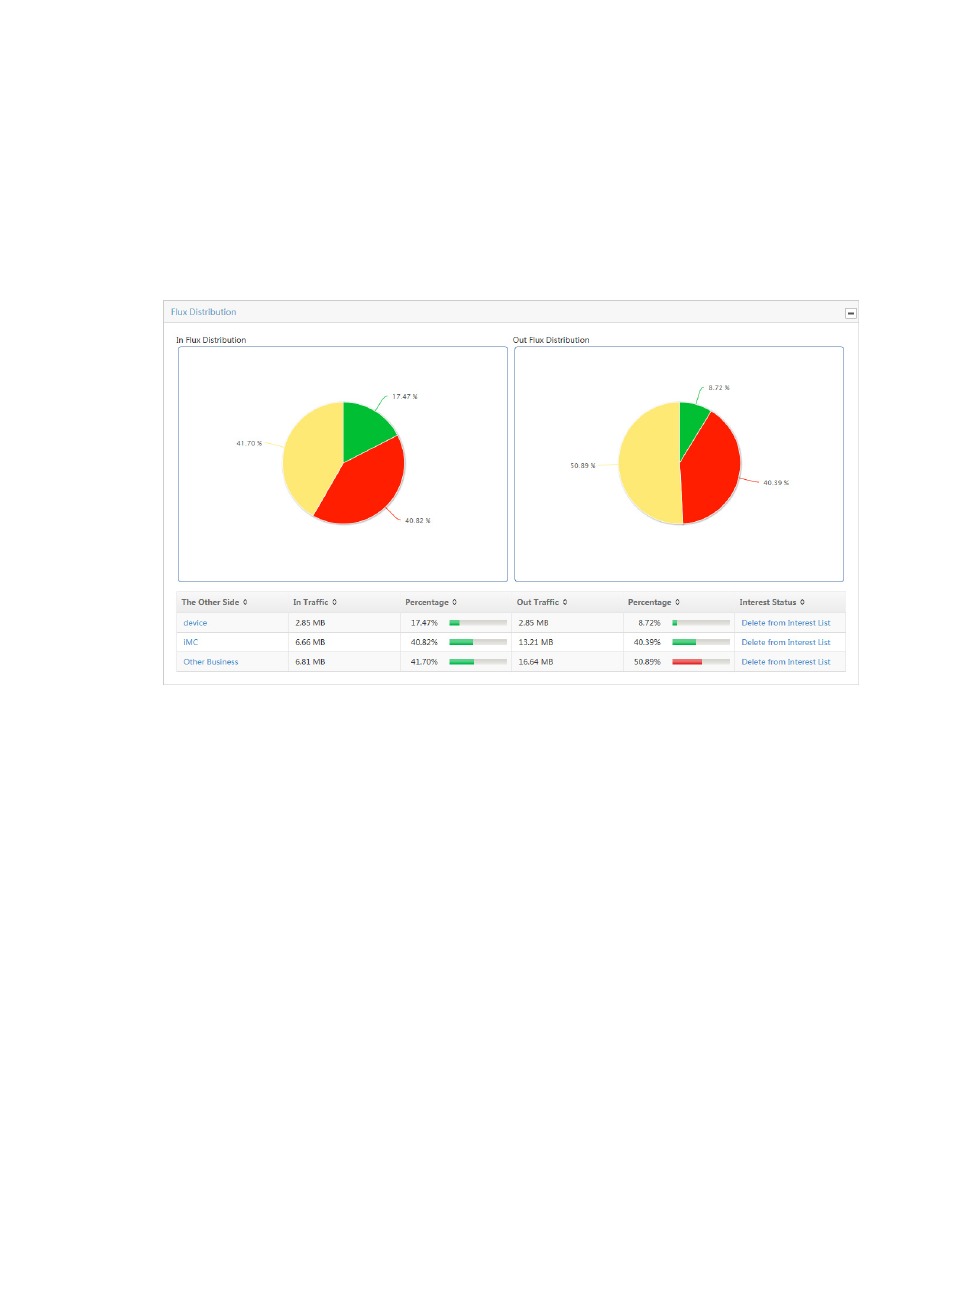
Flux Distribution
The In/Out Flux Distribution chart displays the distribution of inbound and outbound traffic for the select
business. This chart also provides the total volume of traffic and the percentage of all observed traffic for
the associated business.
Figure 222 Single Business Report: Flux Distribution Report
To view this report for a single business traffic in a task, click the bar in the TopN Avg. Rate chart report
for the business for which you want to view reports.
To add a single host and application group in a task to the Interest List, click the Add to Interest List link
for the associated business service you want to add.
Inter-Business reports
Inter-Business reports for an inter-business traffic analysis task include the TopN Avg. Rate stacked bar
chart that provides average per second inbound and outbound traffic rates between all hosts and
applications in the selected traffic analysis task for the selected time range and all other business services.
The inter-business reports also include the Traffic Details list that provides you with a summary of total
traffic volume and rate in seconds between inbound and outbound traffic for all host and application
groups in the selected task and all other business services. As with each of the report types, NTA also
provides you with a query option for filtering reports based on criteria you define.
Click the Inter-Business tab in the inter-business traffic analysis report to view the inter-business reports of
the task.
Query traffic
NTA enables you to change the filter criteria for traffic reports. You can refine the data presented in
inter-business reports using the Query Traffic option. Using this feature, you can change the default
settings for the business name as well as the time range for the graphs and tables to customize the
reports.