Application list, Application traffic trend – H3C Technologies H3C Intelligent Management Center User Manual
Page 143
133
The results of your query are displayed in the Application List below the Query Applications
area. To display the full Application List, click Query without entering any search criteria.
c.
Click the boxes next to the applications you want to search for.
Click OK to add the applications to the filter. The applications you selected are displayed in the
Application field. Click the Clear button located to the right of the Application field to clear all
selected applications.
•
Start Time—Enter the start time of the time range, in the format of YYYY-MM-DD hh:mm. Or,
click the Calendar icon
to the right of the input box to manually specify a start time.
•
End Time—Enter the end time of the time range, in the format of YYYY-MM-DD hh:mm. Or,
click the Calendar icon
to the right of the input box to manually specify an end time.
Additionally, to set the start time and end time for the application report, you can click the
query criteria icon in the upper right corner of the application report. On the list that
appears, select Last 1 hour, Last 3 hours, Last 12 hours, Last 24 hours, Last 7 days, Last 30
days, Last 3 months, or Custom. Click the Query icon
in the query criteria area to set the
time range for the traffic report for Layer 4 through Layer 7 applications.
4.
Click OK.
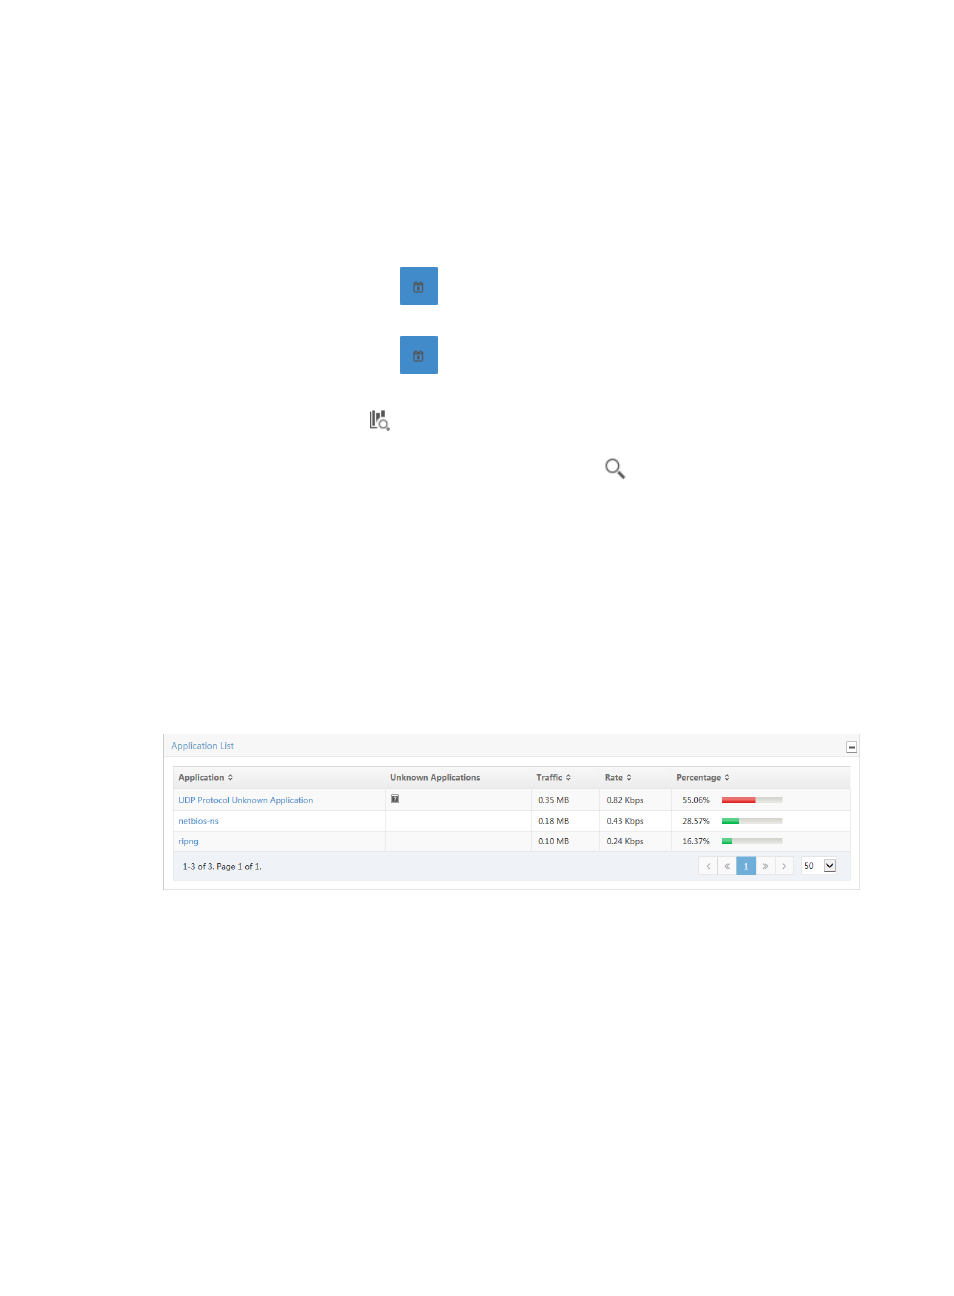
Application list
The Application List displays a list of the applications observed for all VLANs in the selected traffic
analysis task or for a VLAN in a task for the selected time range. This list includes the application name,
a link for viewing the ports for all unknown applications, total volume of traffic for the associated
application, rate of traffic, and the percentage of traffic on all VLANs generated by the associated
application. The application name in the Application field is a link to reports for the selected application.
Figure 54 Application Report: Application List
Select 8, 15, 50, 100, or 200 from the lower right side of the main pane to configure how many items per
page you want to view.
Application traffic trend
The Application Traffic Trend stacked area chart displays the average inbound or outbound traffic rates
for all applications observed for all VLANs in the selected traffic analysis task or for a VLAN in a task for
the selected time range. If there is more than one VLAN for the selected task, these statistics reflect traffic
for all VLANs configured in a task.