Session host traffic trend report, Topn applications for session host – H3C Technologies H3C Intelligent Management Center User Manual
Page 127
117
Session host traffic trend report
To view this report for an interface task or for an interface in a task, click the slice of the pie chart on the
TopN Traffic Report for Session Host report for the session pair you want to view statistics for. Or, click the
Details icon
on the TopN Traffic List for Session Host.
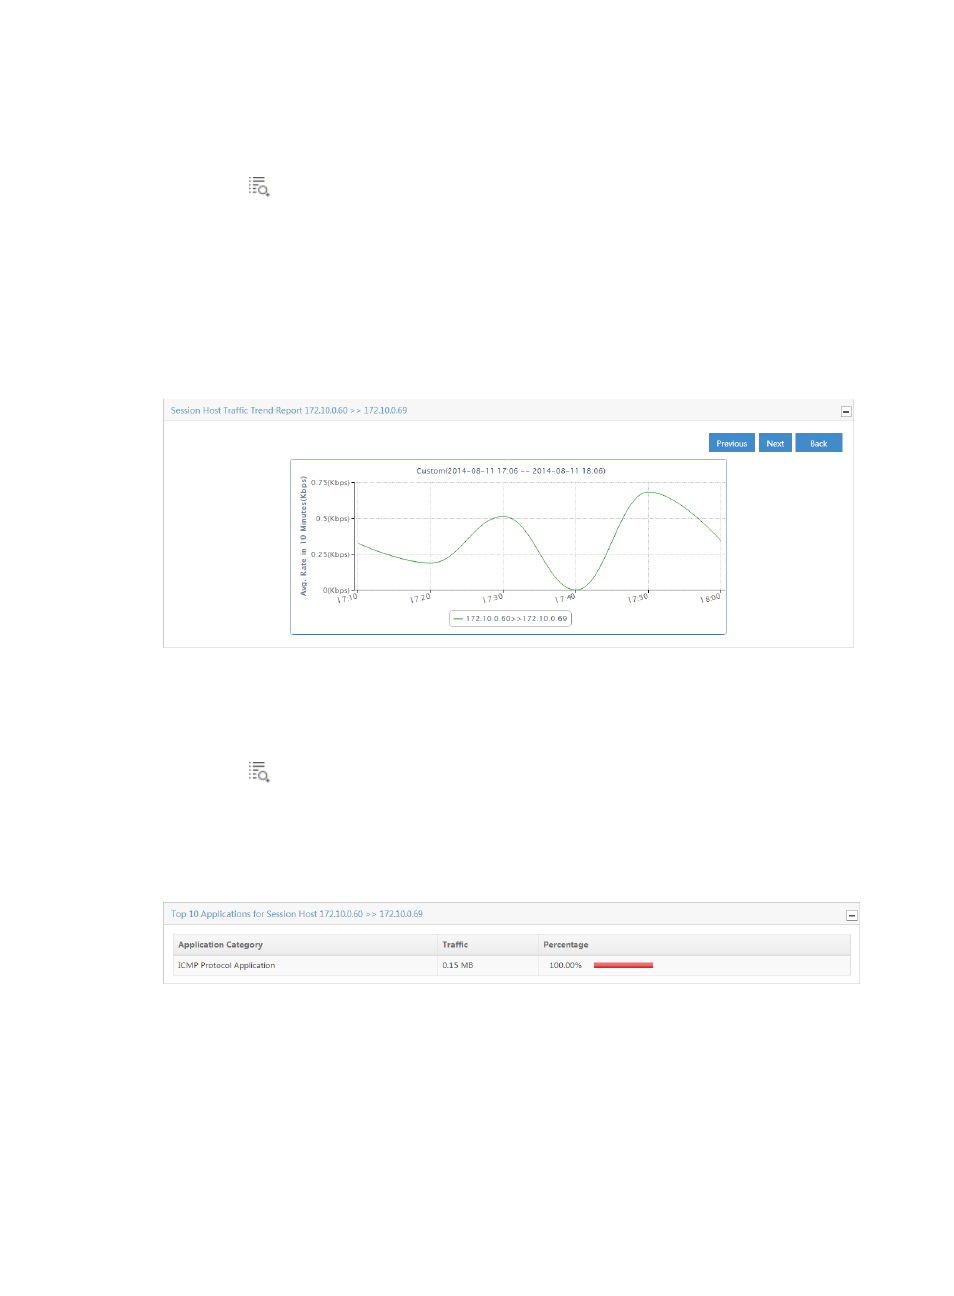
The Session Host Traffic Trend Report line chart provides the average rate of traffic for the source and
destination host pair. By default, the Session Host Traffic Trend Report chart displays statistics for the
previous hour.
•
In the upper right corner of the chart, click the Previous button to view data for an earlier period.
•
In the upper right corner of the chart, click the Next button to view data for a later period.
•
Click Back to return to the main Session report page.
Figure 44 Session Report: Session Host Traffic Trend Report
TopN applications for session host
To view this report for an interface task or for an interface in a task, click the slice of the pie chart on the
TopN Traffic Report for Session Host report for the session pair you want to view statistics for. Or, click the
Details icon
on the TopN Traffic List for Session Host.
The TopN Applications for Session Host displays the TopN applications observed for the selected session
pair, the volume of traffic sent and received between this session pair, and the percentage of all traffic
observed for the session pair.
Figure 45 Session Report: TopN Applications for Session Host