Application category traffic trend, Individual application category reports – H3C Technologies H3C Intelligent Management Center User Manual
Page 192
182
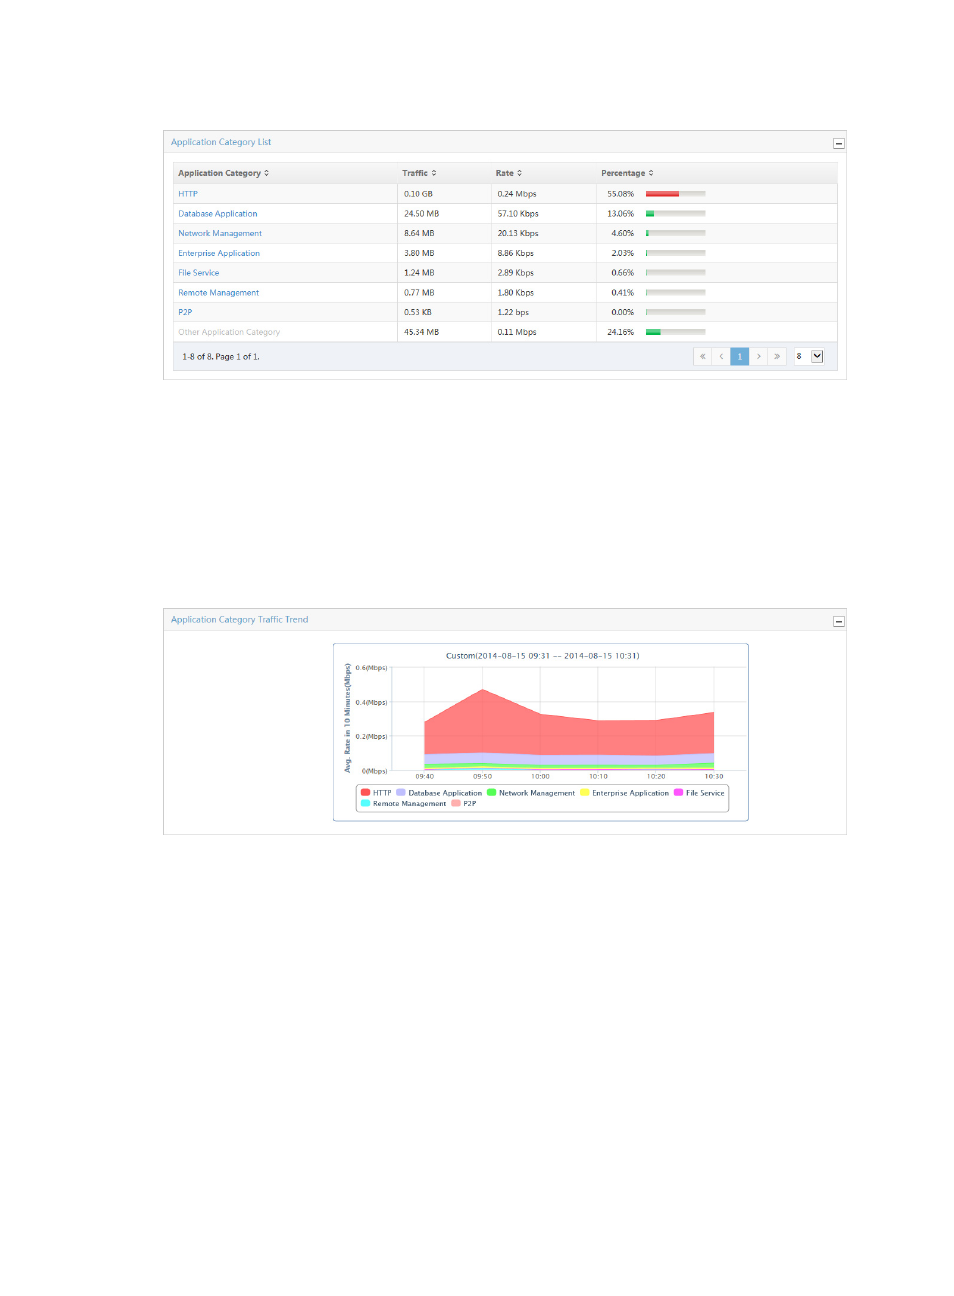
Figure 109 Application Report: Application Category List
Select 8, 15, 50, 100, or 200 from the lower right side of the main pane to configure how many items per
page you want to view.
Application category traffic trend
The Application Category Traffic Trend stacked area chart provides average traffic rates for all
application categories captured by the probe in the selected traffic analysis task for the selected time
range.
Figure 110 Application Report: Application Category Traffic Trend
Individual application category reports
NTA provides traffic trend statistics for the individual application categories that are captured by the
probe for a selected task. Individual application category reports include the Application Category
Traffic Trend report and the TopN Application Category Usage List.
To view application category reports for a probe task, click the name in the Application Category field
of the Application Category List report for the application category for which you want to view this report.
For more information about Application Category List, see "
Application category traffic trend
The Application Category Traffic Trend graph displays the average rate for an individual application
category captured by the probe in the selected traffic analysis task. By default, this graph displays
statistics for the previous hour.
•
To view data for an earlier period, click the Previous button in the upper right corner of the chart.