H3C Technologies H3C Intelligent Management Center User Manual
Page 287
277
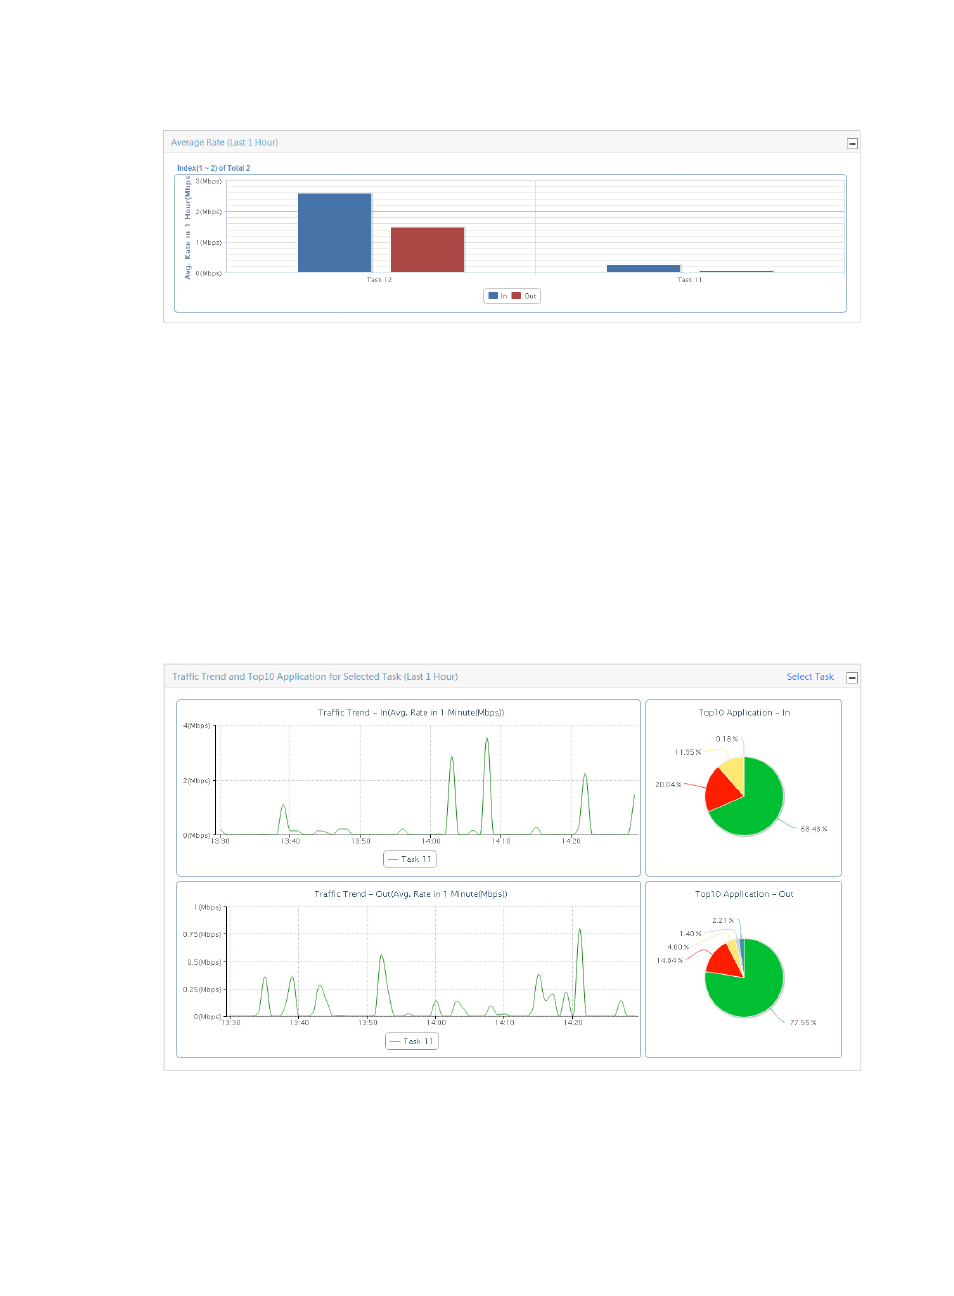
Figure 179 Summary Report: Average rate (Last 1 hour)
Traffic trend and TopN application for selected task (last 1 hour)
The Traffic Trend – In line chart provides inbound traffic trend rates for all VPN traffic analysis tasks for
the last hour.
The Traffic Trend – Out line chart provides outbound traffic rates for all VPN traffic analysis tasks for the
last hour.
The TopN Application – In pie chart displays the distribution of traffic for the TopN applications for all
VPN traffic analysis tasks for the last hour. The slices in the pie chart are links for navigating to the reports
for the selected application.
The TopN Applications – Out pie chart displays the distribution of traffic for the TopN applications for the
selected VPN task for the last hour. The slices in the pie chart are links for navigating to the reports for the
selected application.
Figure 180 Summary Report: TopN Application for Selected Task
All VPN tasks are graphed on these charts until you specify a task.
1.
In the upper right corner of the Traffic Trend and TopN Application for Selected Task title bar, click
the Select Task link to select the task.