Source reports, Query sources – H3C Technologies H3C Intelligent Management Center User Manual
Page 157
147
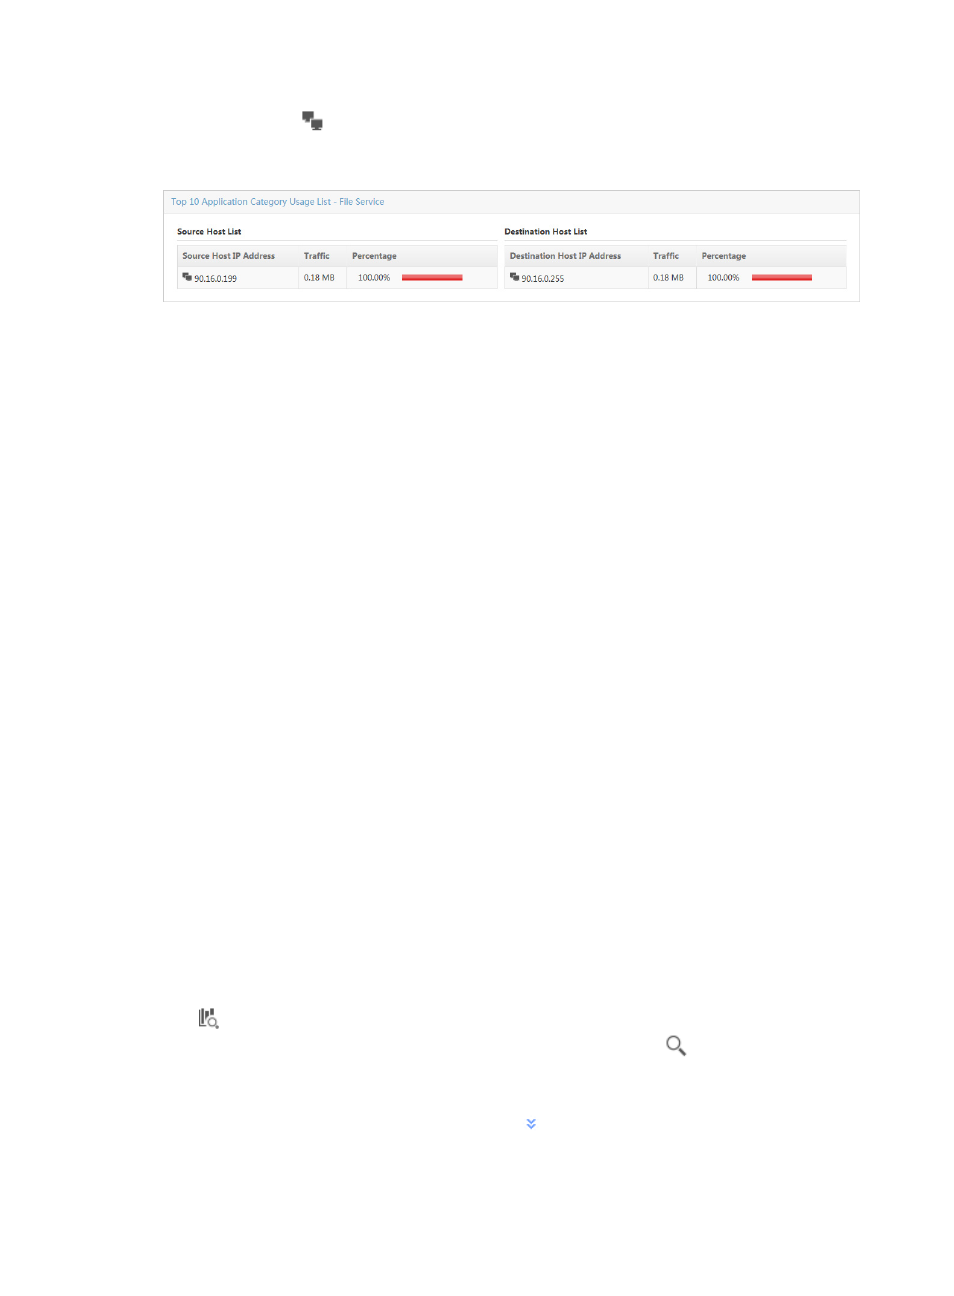
The host query icon
next to the Source Host IP Address and Destination Host IP Address is a link for
initiating a host query and a link for to the results of the query.
Figure 77 Application Category Report: TopN Application Category Usage List
Source reports
Source reports provide rate and percentage distribution of traffic by source host for all VLANs configured
in a VLAN traffic analysis task or for an individual VLAN in a task. Click the Source tab to view traffic
reports.
Source reports contain the following fields:
•
Query Sources—Set the time range for the source host reports.
•
TopN Traffic Report for Source Host—The pie chart displays the distribution of traffic that generated
by the TopN source hosts for all VLANs in the selected traffic analysis task or for a VLAN in a task.
•
TopN Traffic List for Source Host—Provides a list of the TopN source hosts, measured by volume of
traffic on all VLANs in the selected traffic analysis task or for a VLAN in a task.
•
Traffic Trend Report for Source Host—Provides the average rate of traffic for the selected source
host.
•
Traffic Details—Provides two lists for a source host table:
{
TopN Destination Hosts Communicating with the Source Host
The list displays the TopN destination host IP addresses, the volume of traffic sent and received
between this source and destination hosts, and the percentage of all traffic observed for this
source and destination hosts.
{
TopN Applications Communicating with the Source Host
The list displays the TopN applications, the volume of traffic attributed to the associated
application for the selected source host, and the percentage of the associated application
traffic observed for this source host.
The introduction to source host reports also applies to individual VLANs in VLAN traffic analysis tasks.
Query sources
NTA enables you to change the filter criteria for source reports. You can change the default settings for
source host, or time range to customize the charts and lists displayed.
1.
In the query criteria area in the upper right corner of the source report, click the query criteria icon
. On the list that appears, select Last 1 hour, Last 3 hours, Last 12 hours, Last 24 hours, Last 7
days, Last 30 days, Last 3 months, or Custom. Click the Query icon
in the query criteria area
to set the time range for the source report.
2.
To customize the time range for the source report, select Custom from the list that appears in the
query criteria area, or click the Advanced icon
to the right of the query criteria field to expand
the query criteria setting area.
3.
Enter one or more of the following query criteria: