Traffic trend - average – H3C Technologies H3C Intelligent Management Center User Manual
Page 248
238
b.
From Page Range, select the page range.
c.
To export the data, click Export.
d.
To export this report, click the export icon
on the toolbar.
e.
From the File Format list, select the export file format. Options are:
•
Crystal Reports (RPT)
•
•
Microsoft Excel (97-2003)
•
Microsoft Excel (97-2003) Data–Only
•
Microsoft Word (97-2003) – Editable
•
Rich Text Format (RTF)
•
Comma Separated Values (CSV)
f.
From Page Range, select the page range.
g.
Click Export.
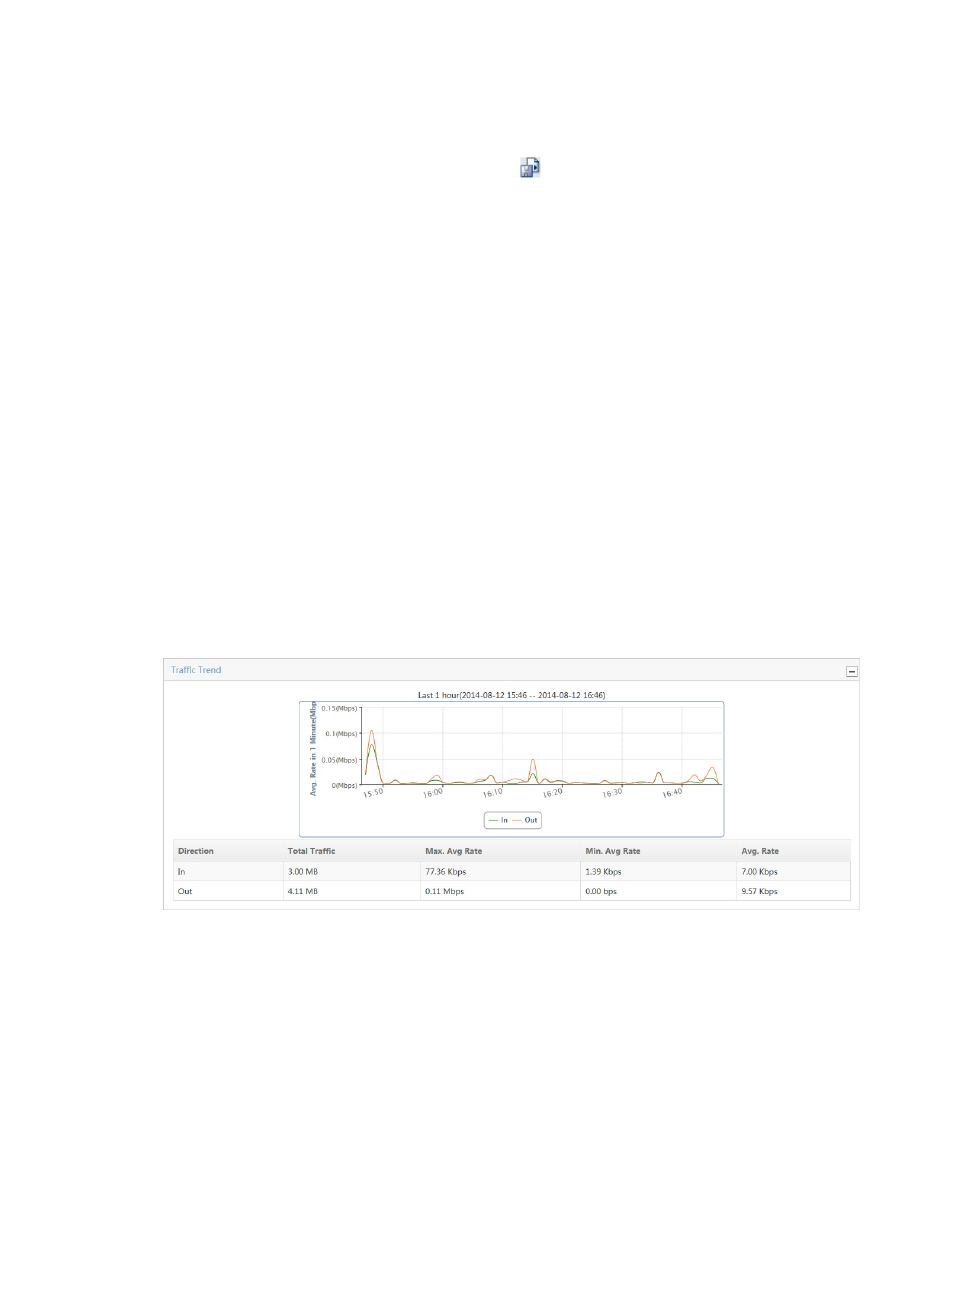
Traffic trend - average
The Traffic Trend combination line and area chart provides average per second traffic rate for all hosts
in the selected traffic analysis task for the selected time range. This chart also provides average, minimum
average, maximum average, and total traffic volume statistics in a tabular format for all hosts in the
associated task. If there is more than one host for the selected task, these statistics reflect traffic for all
hosts configured in a task.
Figure 144 Traffic Report: Traffic Trend Report
If the Baseline Analysis feature is enabled for the selected traffic analysis task, the Traffic Trend
combination line chart shows two charts: inbound Traffic Trend and outbound Traffic Trend. The green
line is the baseline and the red area is the average traffic rate. For more information about configuring
the Baseline Analysis feature for the host traffic analysis task, see "
Configuring NTA traffic analysis
."