Trendlog.exe program, Viewing trendlog data – WattMaster WM-WCC3-TGD-01B User Manual
Page 448
8-8
8. TRENDLOG.EXE PROGRAM
WCC III Technical Guide
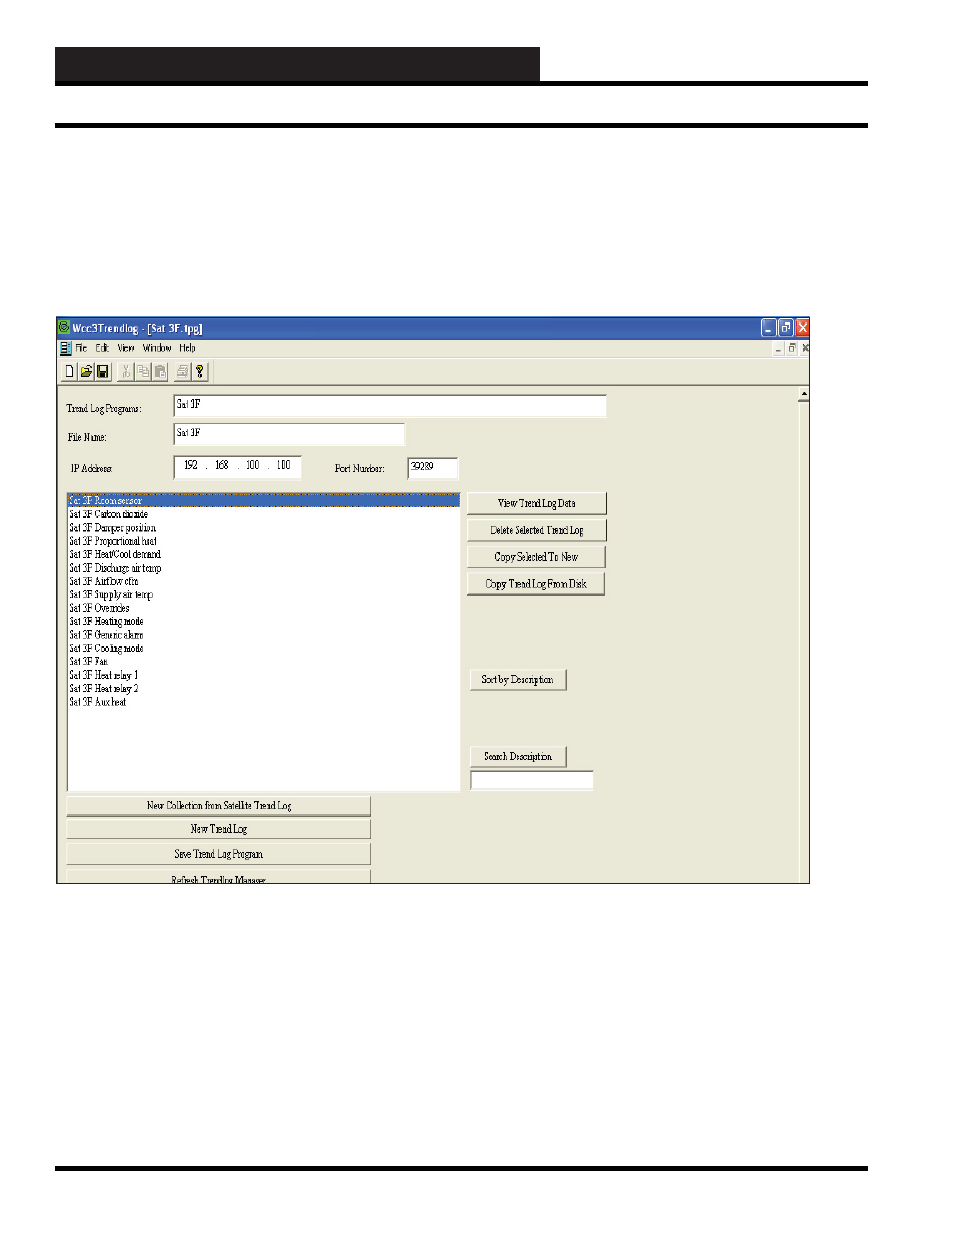
View Trendlog Data
Once data has started to collect from the points that were chosen
to trend log, then this screen will display that data. The columns
will have the names above each one that the programmer assigned
to each column. This screen will not automatically update. To get
the most recent data, this screen will need to be closed and then
reopened.
Export:
The
<Export>
button will create an Excel fi le with the same
name as the Trend Program. This fi le will be created in the “WCC
Trendlogging” folder where the WCC Trendlog Program resides.
This will usually be C:\Program Files\WCCIII Trendlogging. The
Excel fi le will have an “.exe” extension. This Excel fi le will not
automatically update itself. Each time the
<Export>
button is
pressed, the data from the trend log is recorded in the Excel fi le.
View Chart:
The
<View Chart>
button will open a window with a line chart in
it. This will graphically display all the information for the Trend
Log. The time and date will be displayed horizontally across the
bottom of the chart. The values for the data will be displayed
vertically on the sides of the graph with the “Minimum Value” for
each column displayed at the bottom and the “Maximum Value”
for each column displayed at the top. If there are multiple points
being trended on this trend log, then you may want to change pen
colors, pen style, or pen width so that the chart is easier to view for
the different points.
Viewing Trendlog Data