Data-driven graphics, About data-driven graphics, Variables panel overview – Adobe Illustrator CS4 User Manual
Page 451
444
USING ADOBE ILLUSTRATOR CS4
Automating tasks
Data-driven graphics
About data-driven graphics
Data-driven graphics make it possible to produce multiple versions of artwork quickly and accurately. Let’s say, for
example, that you need to produce 500 different web banners based on the same template. Instead of manually
populating the template with data (images, text, and so on), data-driven graphics let you use a script referencing a
database to generate the web banners for you.
In Illustrator, you can turn any piece of artwork into a template for data-driven graphics. All you need to do is define
which objects on the artboard are dynamic (changeable) using variables. You use variables to change text strings,
linked images, graph data, and the visibility setting of objects in your artwork. In addition, you can create different sets
of variable data in order to easily view what your template will look like when it is rendered.
Data-driven graphics are designed for use in collaborative work environments. Following are some examples of how
data-driven graphics fit into different job roles:
•
If you’re a designer, creating a template gives you control over the dynamic elements of your design. When you
hand your template over for production, you can be sure that only the variable data will change.
•
If you’re a developer, you can code variables and data sets directly into an XML file. The designer can then import
the variables and data sets into an Illustrator file to create a design based on your specifications.
•
If you’re responsible for production, you can use scripts within Illustrator, the Batch command, or a web
production tool such as Adobe GoLive 6.0 to render the final graphics. You can also use a dynamic imaging server
such as Adobe® Graphics Server to further automate the rendering process.
See also
Variables panel overview
You use the Variables panel (Window
> Variables) to work with variables and data sets. The type and name of each
variable in the document are listed in the panel. If the variable is bound to an object, then the Objects column displays
the name of the bound object as it appears in the Layers panel.
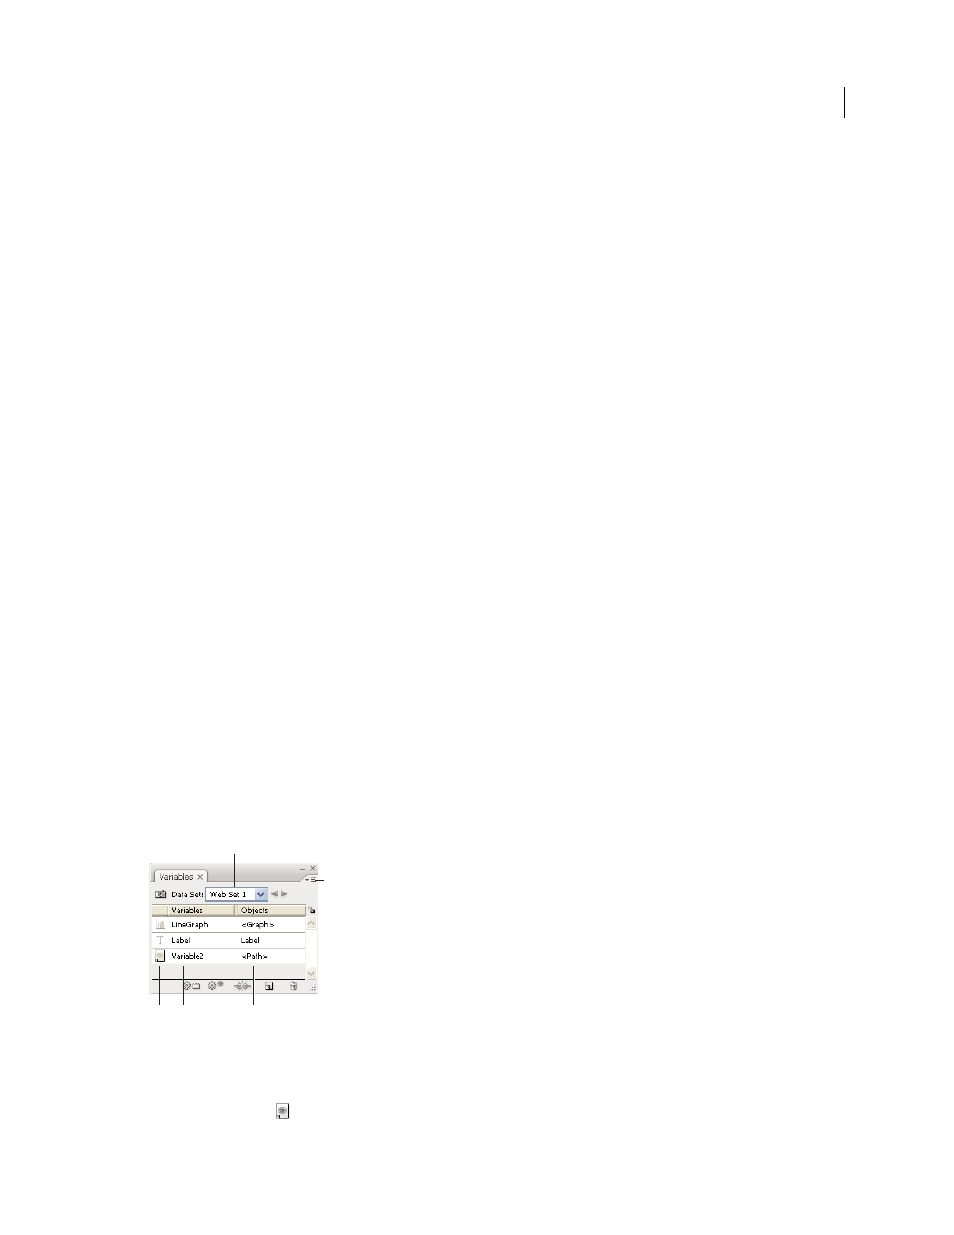
Variables panel
A. Data set B. Panel menu C. Variable type D. Variable name E. Name of bound object
The Variables panel uses the following icons to indicate a variable’s type:
•
Visibility variable
.
B
A
C D
E