Adjust the width of columns, Adjust the decimal precision for cells, Enter graph data – Adobe Illustrator CS4 User Manual
Page 457
450
USING ADOBE ILLUSTRATOR CS4
Graphs
Adjust the width of columns
❖
Do one of the following:
•
Click the Cell Style button
, and enter a value between 0 and 20 in the Column Width text box.
•
Position the pointer at the edge of the column you want to adjust. The pointer changes to a double arrow
.
Then drag the handle to the desired position.
Adjust the decimal precision for cells
❖
Click the Cell Style button, and enter a value between 0 and 10 in the Number of Decimals text box.
Enter graph data
You use the Graph Data window to enter the data for your graph. The Graph Data window appears automatically when
you use a graph tool and stays open until you close it.
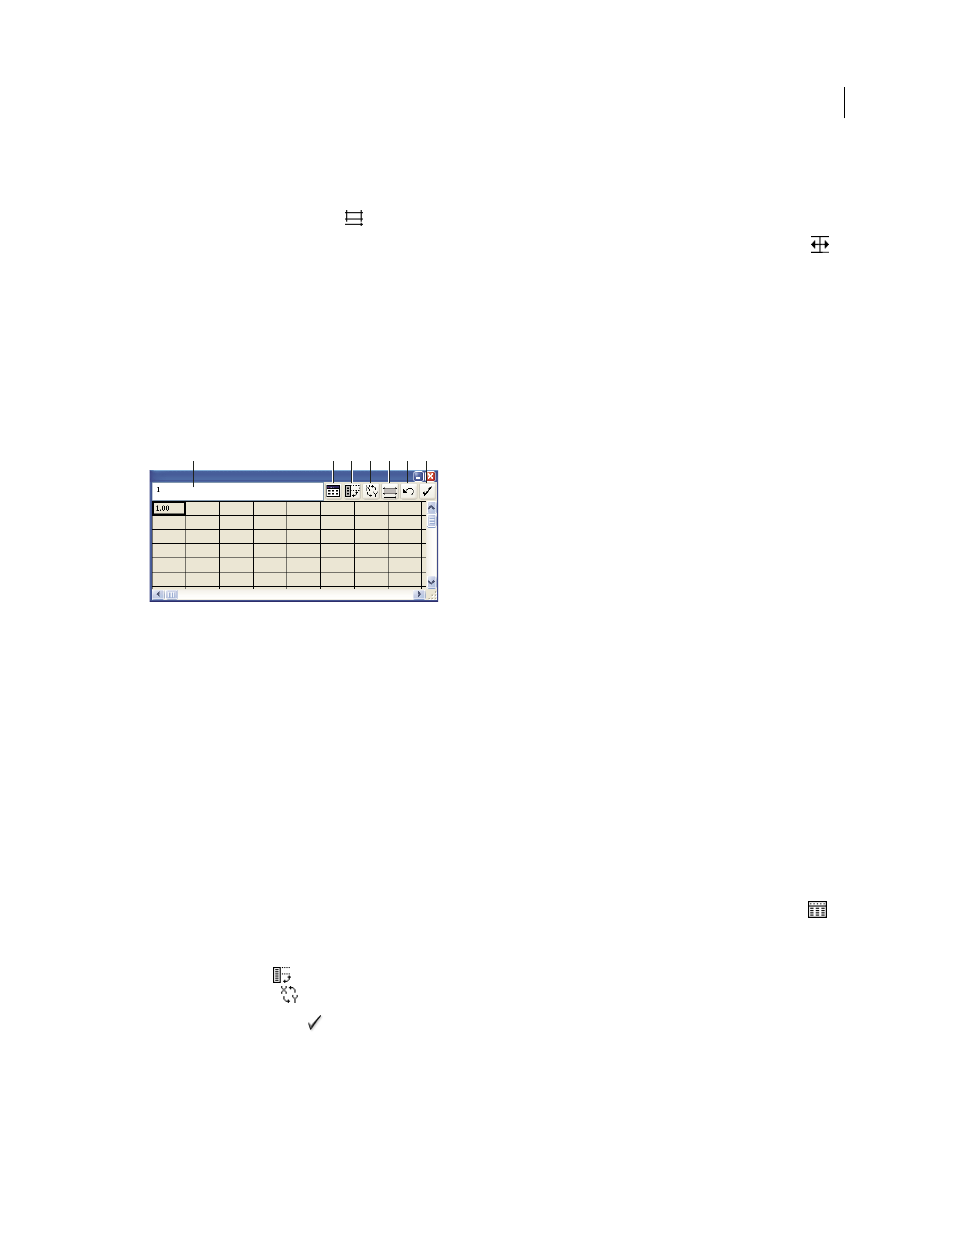
Graph data window
A. Entry text box B. Import data C. Transpose row/column D. Switch x/y E. Cell style F. Revert G. Apply
1
Display the Graph Data window for an existing graph: select the entire graph with the Selection tool, and then
choose Object > Graph
> Data.
2
Enter data in any of the following ways:
•
Select a cell in the worksheet, and enter the data in the text box at the top of the window. Press Tab to input the
data and select the next cell in the same row; press Enter or Return to input the data and select the next cell in
the same column; use the arrow keys to move from cell to cell; or simply click another cell to select it.
•
Copy data from a spreadsheet application such as Lotus® 1-2-3 or Microsoft Excel. In the Graph Data window,
click the cell that will be the upper-left cell of the data you paste, and choose Edit > Paste.
•
Use a word-processing application to create a text file in which the data for each cell is separated by a tab, and
the data for each row is separated by a paragraph return. The data can only contain decimal points or decimal
commas; otherwise, the data is not plotted. (For example, enter 732000, not 732,000.) In the Graph Data
window, click the cell that will be the upper-left cell of the data you import, click the Import Data button
,
and select the text file.
Note: If you accidentally enter graph data backward (that is, in rows instead of columns, or vice versa), click the
Transpose button
to switch the columns and rows of data. To switch the x and y axes of scatter graphs, click the
Switch X/Y button
.
3
Click the Apply button
or press the Enter key on the numeric keypad to regenerate the graph.
A B
C
D
E
F
G