Use graph labels and data sets, Enter labels, Enter data sets for scatter graphs – Adobe Illustrator CS4 User Manual
Page 458
451
USING ADOBE ILLUSTRATOR CS4
Graphs
Use graph labels and data sets
Labels are words or numbers that describe two things: the sets of data you want to compare, and the categories across
which you want to compare them. For column, stacked column, bar, stacked bar, line, area, and radar graphs, you enter
labels in the worksheet as follows:
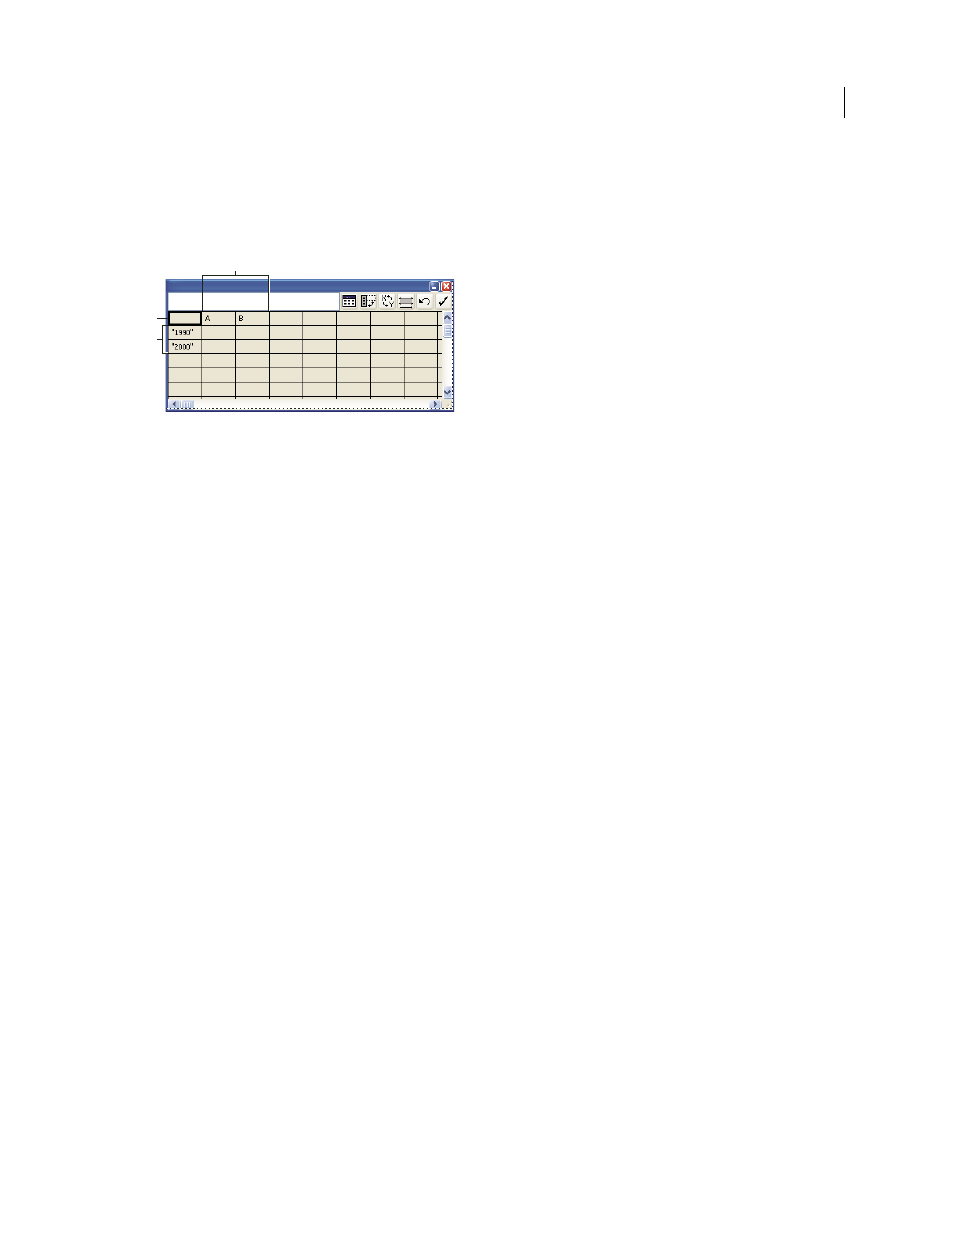
Labels in Graph Data window
A. Data set labels B. Blank cell C. Category labels
Enter labels
❖
For column, stacked column, bar, stacked bar, line, area, and radar graphs, enter labels in the worksheet as follows:
•
If you want Illustrator to generate a legend for the graph, delete the contents of the upper-left cell and leave the
cell blank.
•
Enter labels for the different sets of data in the top row of cells. These labels will appear in the legend. If you don’t
want Illustrator to generate a legend, don’t enter data-set labels.
•
Enter labels for the categories in the left column of cells. Categories are often units of time, such as days, months,
or years. These labels appear along either the horizontal axis or vertical axis of the graph, with the exception of
radar graphs, for which each label results in a separate axis.
•
To create labels consisting only of numbers, enclose the numbers in straight quotation marks. For example, to
use the year 1996 as a label, enter "1996".
•
To create line breaks in labels, use the vertical bar key to separate lines. For example, type
Total|subscriptions|1996 to produce the following graph label:
Total
subscriptions
1996
Enter data sets for scatter graphs
A
scatter graph differs from the other kinds of graphs in that both axes measure values; there are no categories.
B
C
A