Zombie process, Application traffic – H3C Technologies H3C Intelligent Management Center User Manual
Page 148
134
Last 1 Hour icon
, Last 6 Hours icon
, Today icon
, Yesterday icon
, This Week icon
, This Month icon
, and This Year icon
.
•
Attribute/Value—Monitor index name and data.
{
Zombie Process Number—Number of zombie processes in the most recent polling interval.
{
History Record—Click the History Record icon
to view the change trend of the zombie
process number in last 1 hour, last 6 hours, today, yesterday, this week, this month, or this year.
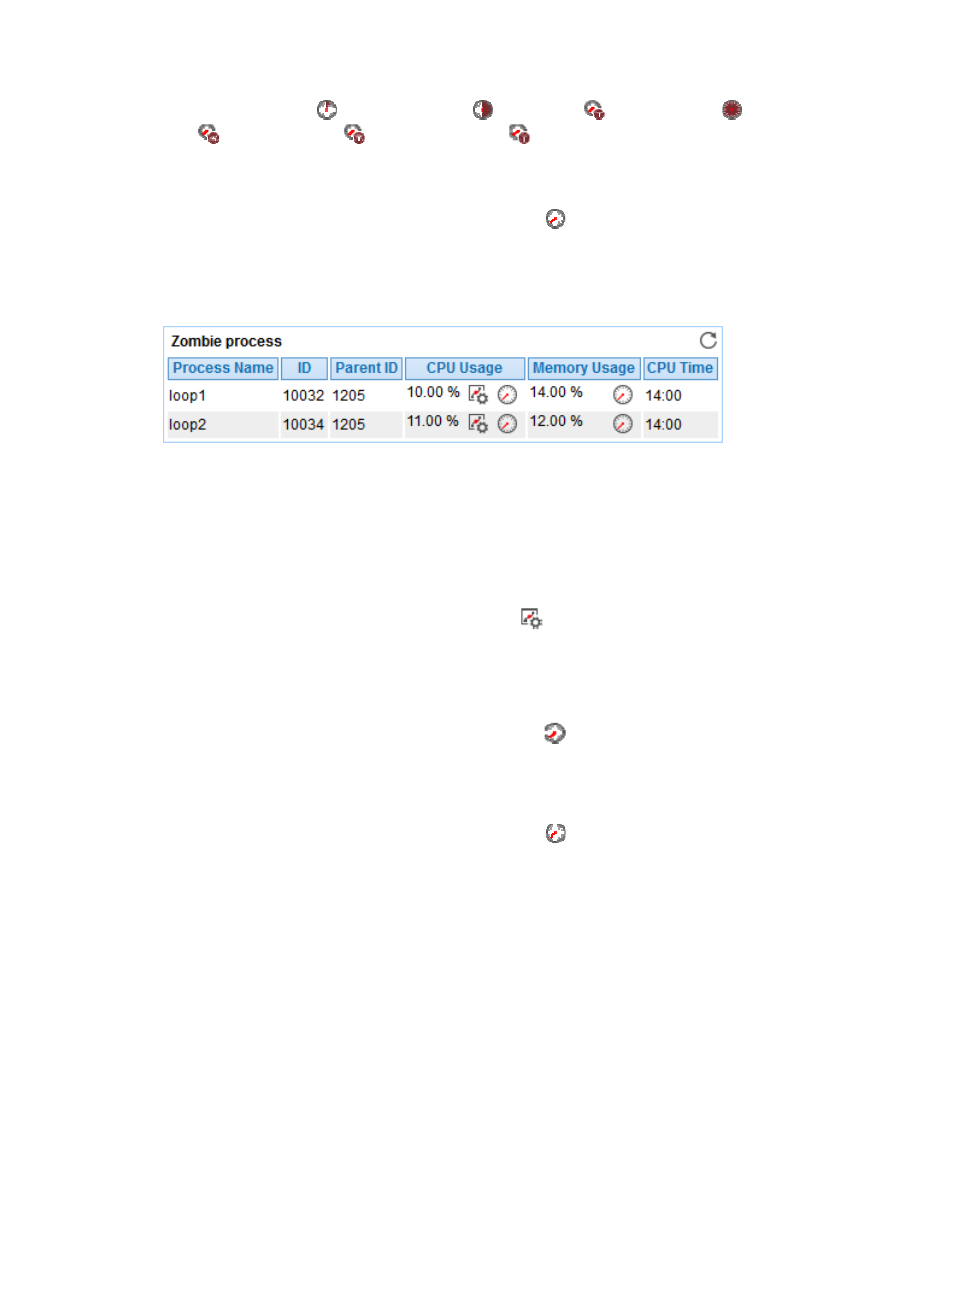
Zombie Process
Figure 82 Zombie Process area layout
Zombie Process area fields:
•
Process Name—Name of the zombie process in the most recent polling interval.
•
ID—ID of the zombie process in the most recent polling interval.
•
Parent ID—ID of the parent process for the zombie process in the most recent polling interval.
•
CPU Usage—CPU usage of the zombie process in the most recent polling interval.
{
Set Threshold—Click the Set Threshold icon
to set alarm thresholds for the CPU usage of the
zombie process. The data is highlighted in orange when the CPU usage of the zombie process
reaches the level-1 threshold, and is highlighted in red when the CPU usage of the zombie
process reaches the level-2 threshold. You can set global thresholds or custom thresholds. For
information about setting the thresholds, see "
{
History Record—Click the History Record icon
to view the history graph of the CPU usage
of the zombie process in last 1 hour, last 6 hours, today, yesterday, this week, this month, or this
year.
•
Memory Usage—Memory usage of the zombie process in the most recent polling interval.
{
History Record—Click the History Record icon
to view the history graph of the memory
usage of the zombie process in last 1 hour, last 6 hours, today, yesterday, this week, this month,
or this year.
•
CPU Time—Duration that the zombie process occupies the CPU in the most recent polling interval.
Application Traffic
APM collects Solaris traffic based on the IP address of the host where the application resides. The
Application Traffic area layout is shown in