H3C Technologies H3C Intelligent Management Center User Manual
Page 248
234
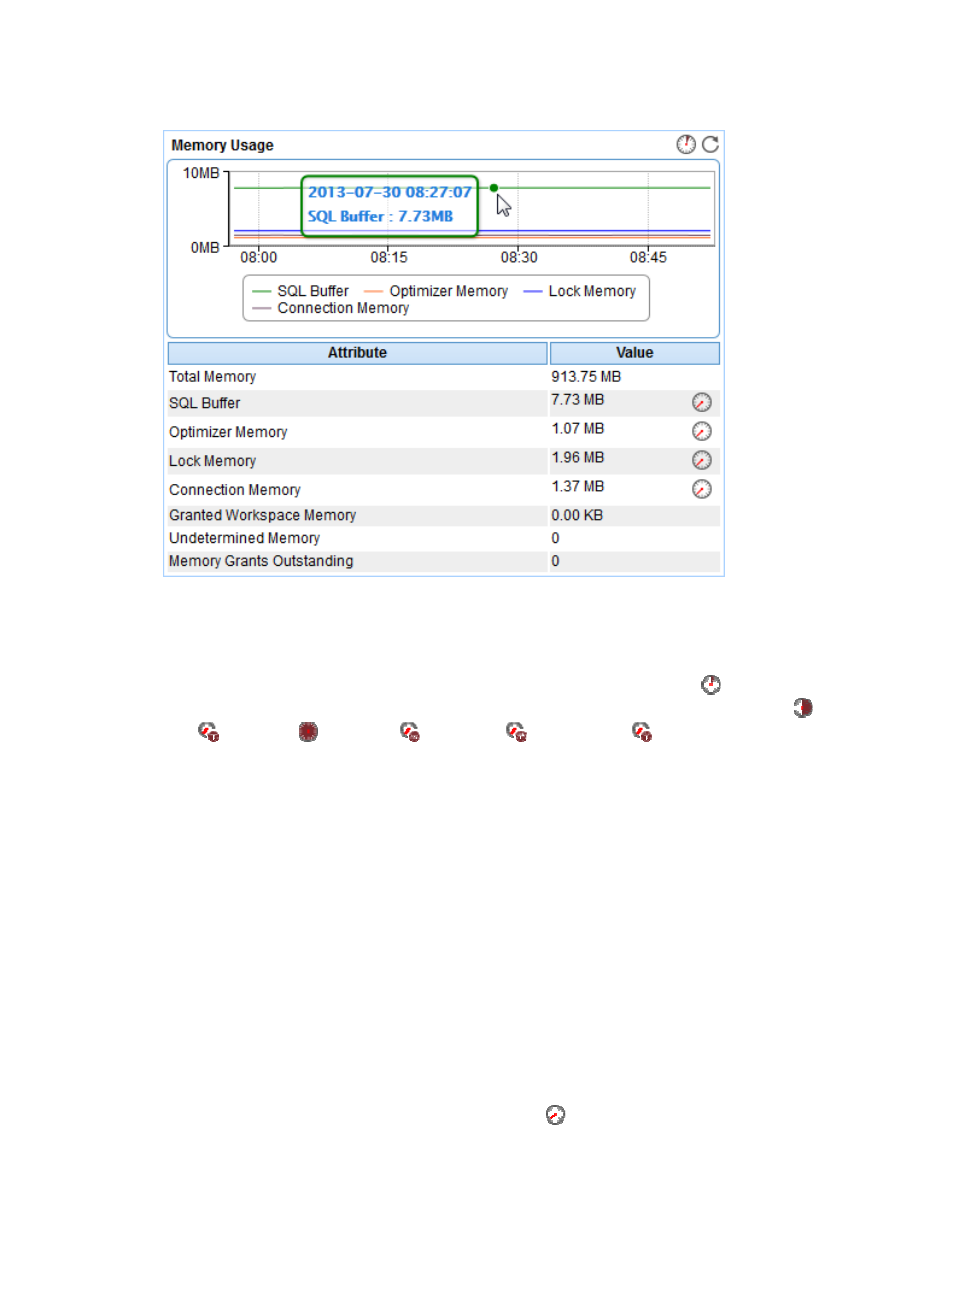
Figure 184 Memory Usage area layout
Memory Usage area fields:
•
Memory usage trend graph—Shows the memory usage trend of the SQL Server over the last 1 hour
in a line chart. Point to a spot on the curve to view the memory usage of the SQL Server at the
specific time point. To change the report period, click the Last 1 Hour icon
on the upper right of
the graph, and then select an icon from the list. Available options include Last 6 Hours
, Today
, Yesterday
, This Week
, This Month
, and This Year
.
•
Attribute/Value—Monitor index name and data that was obtained when APM last polled the SQL
Server.
{
Total Memory—Total size of dynamic memory used by the SQL Server.
{
SQL Buffer—Size of dynamic memory used by the SQL Server for SQL cache.
{
Optimizer Memory—Size of dynamic memory used by the SQL Server to query optimization.
{
Lock Memory—Size of dynamic memory used by the SQL Server for locks.
{
Connection Memory—Size of dynamic memory used by the SQL Server to maintain
connections.
{
Granted Workspace Memory—Size of dynamic memory that the SQL Server allocated for
processes to perform operations, such as hashing, sorting, copying, and creating indexes.
{
Undetermined Memory—Number of processes that were waiting for the permissions to use the
workspace memory.
{
Memory Grants Outstanding—Number of processes that were permitted to use the workspace
memory.
{
History Record—Click the History Record icon
to view the history graph of the memory
usage trend. Point to a spot on the curve to view the memory usage at the specific time point.
Authorized users can view memory usage statistics over the last 1 hour, last 6 hours, today,