Directory statistics – H3C Technologies H3C Intelligent Management Center User Manual
Page 516
502
•
Availability pie chart—Shows time duration percentages of the availability states
for the directory
today. The availability states include Available, Unavailable, Inaccessible, and Unmanaged. To
view the time duration percentage of a specific availability state, place the cursor over the
corresponding slice in the chart.
•
Current Availability—Availability of the directory in the last polling period.
{
To view the availability of the directory in the last 7 days, click the Weekly History icon
. The
weekly availability data is collected hourly. To view the time duration percentages of
availability states at a specific time, place the cursor over that time.
{
To view the availability of the directory in the last 30 days, click the Monthly History icon
.
The monthly availability data is collected daily. To view the time duration percentages of
availability states on a specific day, place the cursor over that day.
•
Available Time—Total available time duration of the directory since 00:00 today.
•
Unavailable Time—Total unavailable time duration of the directory since 00:00 today.
•
Inaccessible Time—Total inaccessible time duration of the directory since 00:00 today.
•
Unmanaged Time—Total unmanaged time duration of the directory since 00:00 today.
The availability time statistics of a new application monitor are collected since the application monitor
was added. An availability time field does not appear if its value is 0.
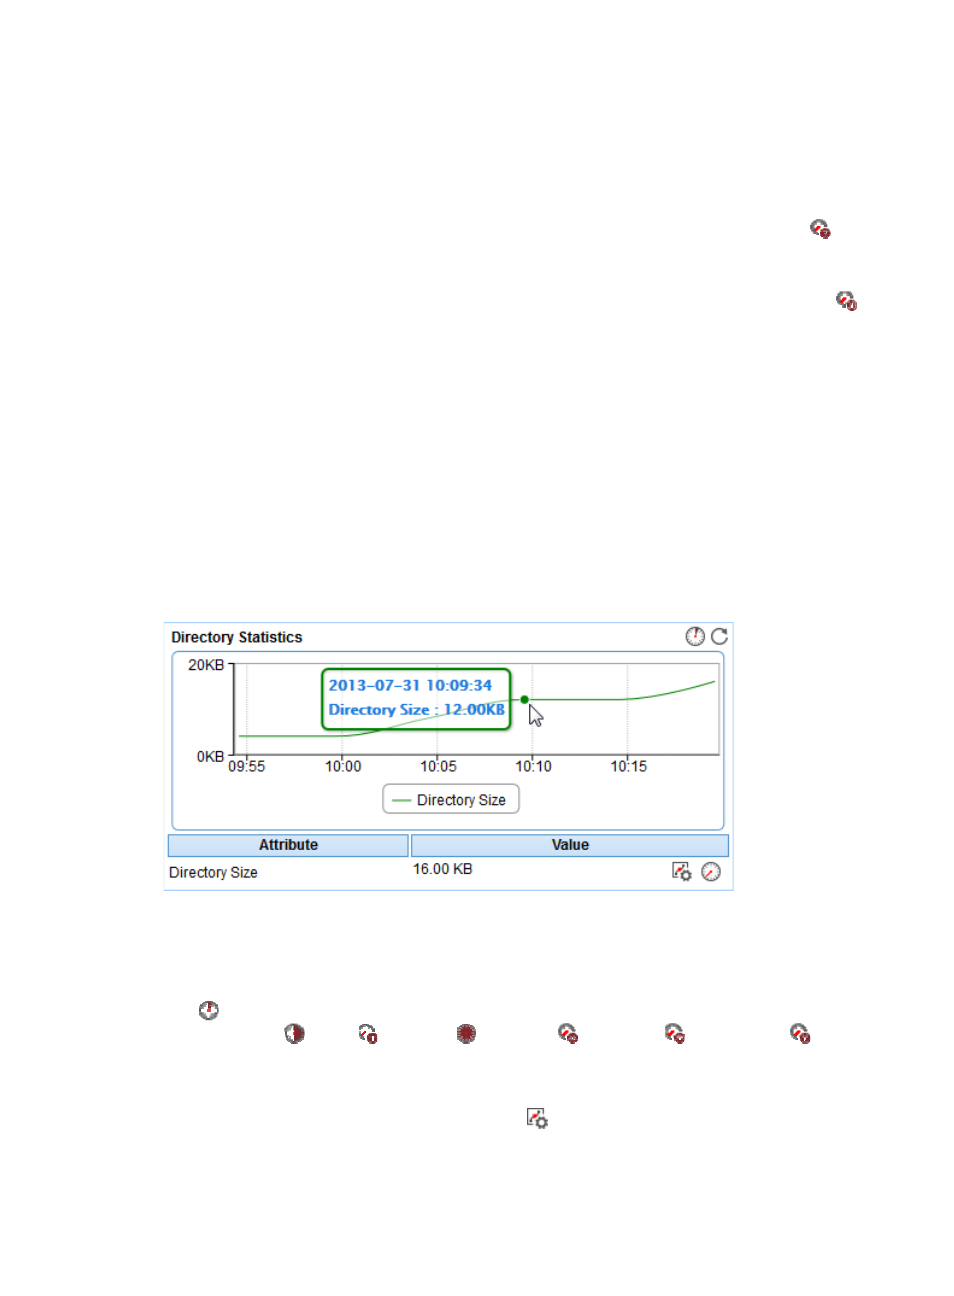
Directory Statistics
The Directory Statistics area layout is shown in
.
Figure 414 Directory Statistics area layout
Directory Statistics area fields:
•
Directory size trend graph—Shows changes of the directory size over the last 1 hour in a line chart.
Place the cursor over a spot in the curve to view the directory size at the specific time point. By
default, the graph shows the last hour data. To change the report period, click the Last 1 Hour icon
on the upper right of the graph, and then select an icon from the list. Available options include
Last 6 Hours
, Today
, Yesterday
, This Week
, This Month
, and This Year
.
•
Attribute/Value—Monitor index name and data.
{
Directory Size—Disk space occupied by the directory in the last polling period.
{
Set Threshold—Click the Set Threshold icon
to set the directory size alarm thresholds. The
specified alarm thresholds appear on the directory size trend graph as dotted lines. The
directory size value is highlighted in orange when it reaches the level-1 threshold, and is