Response time, Application traffic – H3C Technologies H3C Intelligent Management Center User Manual
Page 424
410
•
Available Time—Total available time duration of PHP since 00:00 today.
•
Unavailable Time—Total unavailable time duration of PHP since 00:00 today.
•
Inaccessible Time—Total inaccessible time duration of PHP since 00:00 today.
•
Unmanaged Time—Total unmanaged time duration of PHP since 00:00 today.
The availability time statistics of a new application monitor are collected since the application monitor
was added. An availability time field does not appear if its value is 0.
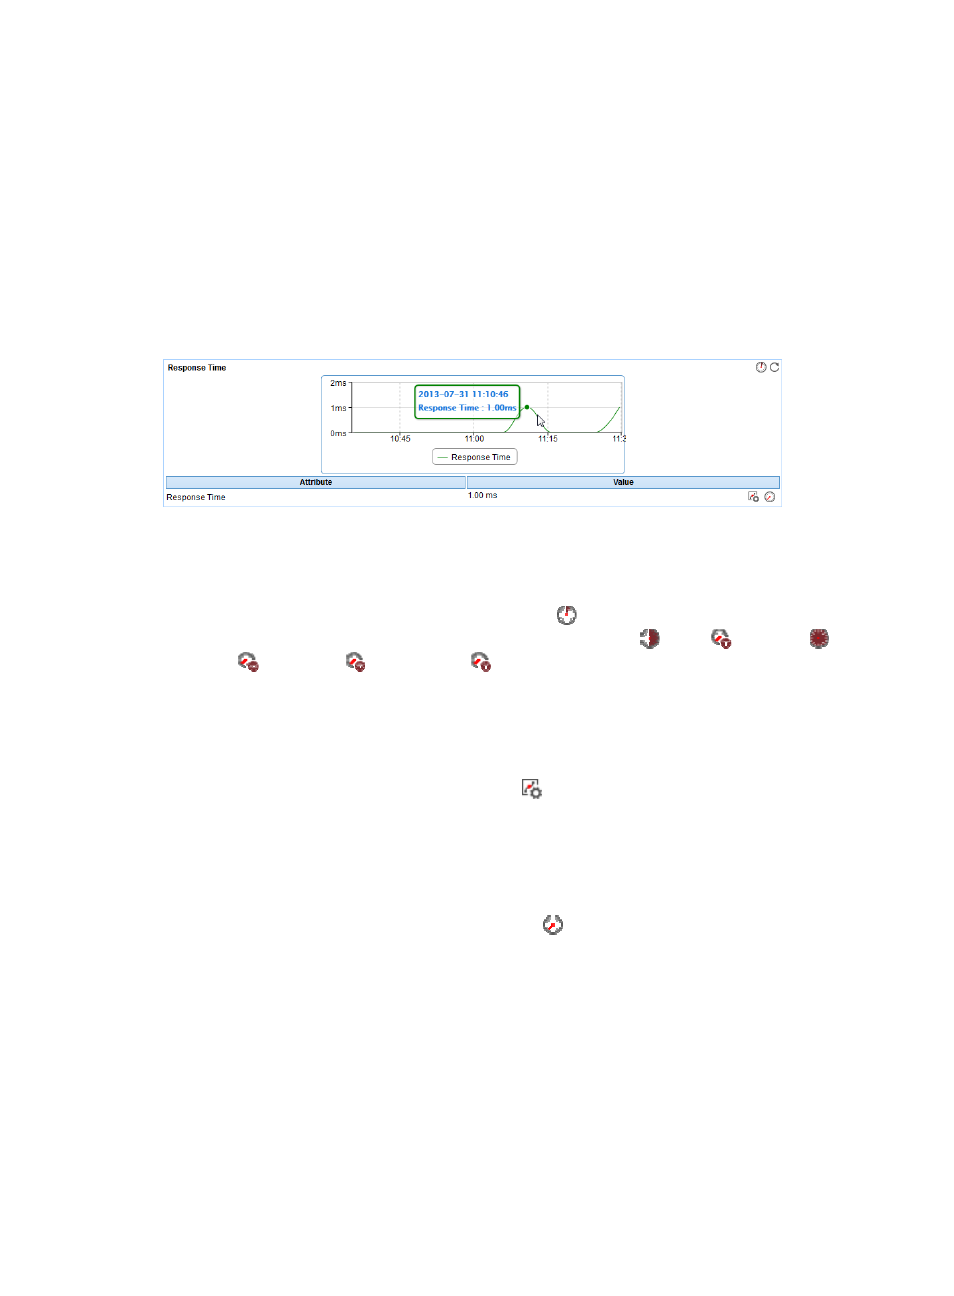
Response Time
The Response Time area layout is shown in
Figure 341 Response Time area layout
Response Time area fields:
•
Response Time trend graph—Shows changes of the PHP response time over the last 1 hour in a
graph. Point to a spot on the curve to view the PHP response time at the specific time point. To
change the report period, click the Last 1 Hour icon
on the upper right of the graph, and then
select an icon from the list. Available options include Last 6 Hours
, Today
, Yesterday
, This
Week
, This Month
, and This Year
.
•
Attribute/Value—Monitor index name and data.
{
Response Time—Response time of PHP when APM last polled PHP. Response time refers to the
length of time it takes for APM to send a request to PHP plus the length of time it takes for APM
to receive the PHP response.
{
Set Threshold—Click the Set Threshold icon
to set the alarm thresholds for the response time
index. With the thresholds enabled, the thresholds are displayed as broken lines in the response
time trend graph. When the level-1 alarm threshold is reached, the index value is highlighted in
orange. When the level-2 alarm threshold is reached, the index value is highlighted in red. Use
the global thresholds or custom thresholds. For information about setting the thresholds, see "
{
History Record—Click the History Record icon
to view the trend statistics of the history PHP
response time. Operators can view PHP response time statistics over the last 1 hour, last 6 hours,
today, yesterday, this week, this month, and this year by clicking the corresponding icons on the
upper right of the graph.
Application Traffic
The Application Traffic area layout is shown in