Tcp port, Adding a tcp port application monitor, N in – H3C Technologies H3C Intelligent Management Center User Manual
Page 559: Figure 451
545
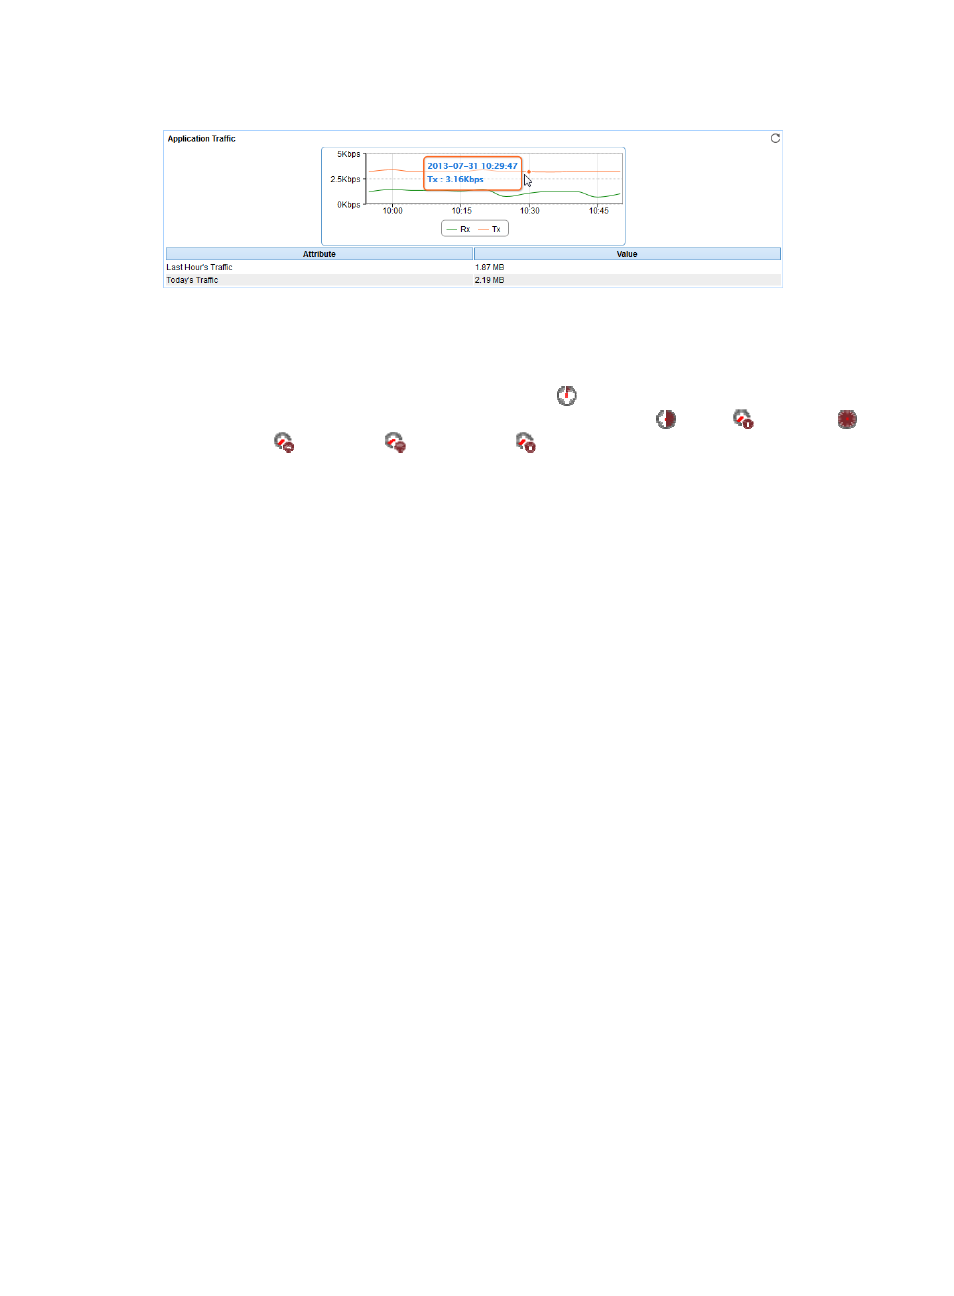
Figure 451 Application Traffic area layout
Application Traffic area fields:
•
Application Traffic trend graph—shows changes of inbound and outbound traffic over the last 1
hour. The green curve shows the inbound traffic and the orange shows the outbound traffic. To
change the report period, click the Last 1 Hour icon
on the upper right of the graph, and then
select an icon from the list. Available options include Last 6 Hours
, Today
, Yesterday
,
This Week
, This Month
, and This Year
. Point to a spot on the curve to view the
application traffic at the specific time point. Click Rx or Tx to display or hide the corresponding
monitor index in the graph.
•
Attribute/Value—Monitor index name and data that was obtained when APM last polled SFTP.
{
Last Hour's Traffic—Total traffic sent and received by SFTP over the last 1 hour.
{
Today's Traffic—Total traffic sent and received by SFTP since 00:00 today.
TCP port
TCP Port application monitor belongs to common monitor. APM monitors applications that use TCP ports
to provide services.
APM sends a TCP connection request to a monitored TCP port and records the time that the application
takes to respond to the request. You can obtain the availability and health status of the application based
on the response time. This section describes how to add a TCP Port application monitor and view the TCP
Port application monitor report.
Adding a TCP Port application monitor
Before APM monitors an application through TCP port, H3C recommends adding the host running the
application to the IMC platform. You can view the network connection between the host running the
application and the access device in the application topology. For information about adding a device
running an application, see H3C IMC Base Platform Administrator Guide.
To add a TCP Port application monitor:
1.
Click the Resource tab.
2.
Enter the Add Application page in one of the following ways:
{
From the navigation tree, select Application Manager > Add Application.
The page displays all application types that can be monitored by APM.
{
From the navigation tree, select Application Manager > Application Monitor, and then click
Add on the application monitor list page.
3.
Click TCP Port of Service Monitor.