Memory status – H3C Technologies H3C Intelligent Management Center User Manual
Page 578
564
thresholds or custom thresholds. For information about setting the thresholds, see "6
{
History Record—Click the History Record icon
to view the history graph of the CPU usage
ratio trend. Point to a spot on the curve to view the CPU usage ratio at the specific time point.
Authorized users can view CPU usage ratio statistics over the last 1 hour, last 6 hours, today,
yesterday, this week, this month, and this year by clicking the corresponding icons on the upper
right of the graph.
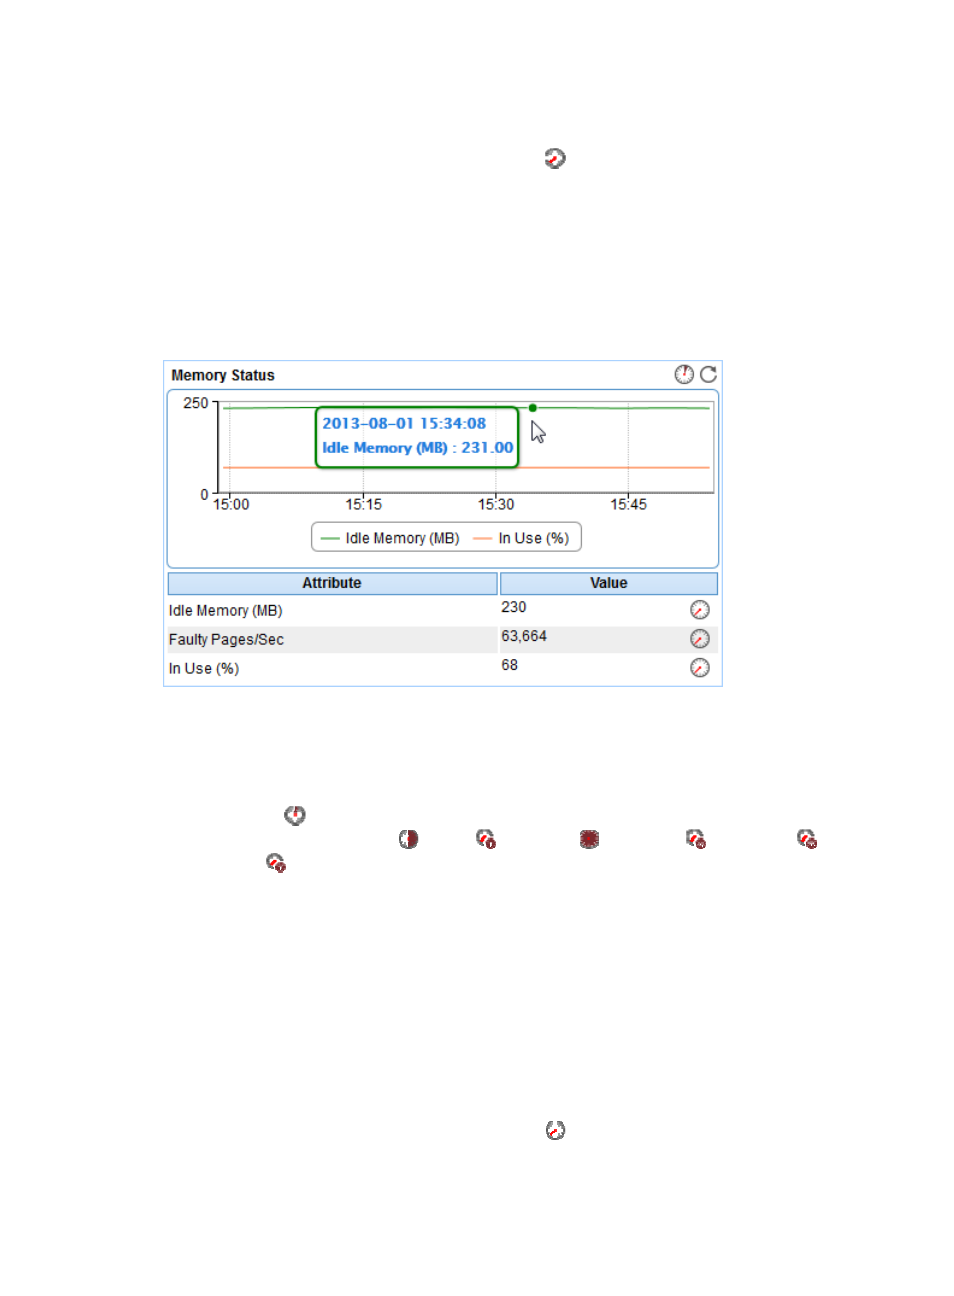
Memory Status
The Memory Status area layout is shown in
Figure 467 Memory Status area layout
Memory Status area fields:
•
Memory Status trend graph—View the changes of the idle memory and the committed virtual
memory usage ratio for the Office SharePoint 2007 application in a line chart. Point to a spot on the
curve to view the monitor data at the specific time point. To change the report period, click the Last
1 Hour icon
on the upper right of the graph, and then select an icon from the list. Available
options include Last 6 Hours
, Today
, Yesterday
, This Week
, This Month
, and
This Year
. Click the legend names to display or hide the corresponding monitor indexes in the
graph.
•
Attribute/Value—Monitor index name and data that was obtained when APM last polled Office
SharePoint 2007.
{
Idle Memory (MB)—Amount of the idle memory of the Office SharePoint 2007 host. Idle
memory can be allocated for use by processes or the system.
{
Faulty Pages/Sec—Average number of
faulty pages counted per second by the operating
system of the Office SharePoint 2007 host.
{
In Use (%)—Committed virtual memory usage ratio of the Office SharePoint 2007 host.
Committed virtual memory usage ratio = committed memory in use/maximum committed virtual
memory × 100%.
{
History Record—Click the History Record icon
to view the history trend graph of the
corresponding index. Point to a spot on the curve to view the monitor data at the specific time
point. Authorized users can view statistics over the last 1 hour, last 6 hours, today, yesterday, this