Vm running status – H3C Technologies H3C Intelligent Management Center User Manual
Page 706
692
•
CPU Count—Number of processors on the VMware ESX server. It is equal to the number of
processors multiplied by the number of cores per processor.
•
Product Line ID—ID of the product line to which the VMware ESX server belongs.
•
NIC Count—Number of NICs on the VMware ESX server.
•
Hardware Vendor Information—Vendor of the VMware ESX server.
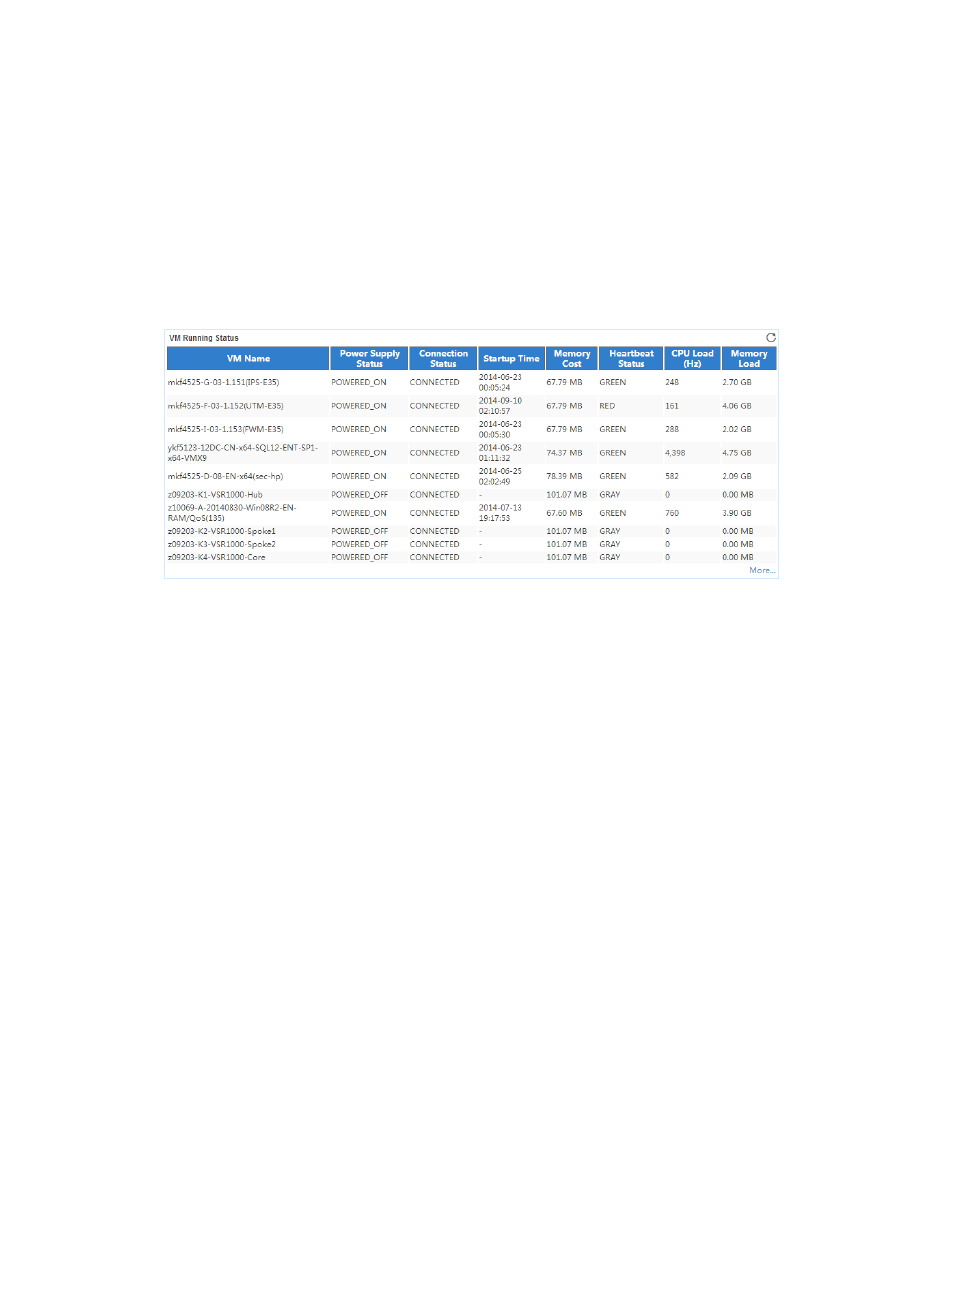
VM Running Status
The VM Running Status area layout is shown in
.
Figure 610 Application Traffic area layout
VM Running Status area fields:
•
VM Name—Name of the VM that is running on the VMware ESX server.
•
Power Supply Status—Power supply status of the VM in the last polling period.
•
Connection Status—Connection status of the VM in the last polling period.
•
Startup Time—Startup time of the VM in the last polling period.
•
Memory Cost—Extra memory cost that occurred when VMware ESX managed the VM in the last
polling period.
•
Heartbeat Status—Heartbeat status of the guest OS of the VM in the last polling period.
{
GREEN—The guest OS responds correctly.
{
YELLOW—The guest OS does not respond sometimes. The guest OS might be overloaded.
{
RED—The guest OS has no heartbeat. The guest OS might not respond.
{
GRAY—VMware ESX tools are not installed on the guest OS or VMware ESX tools stop running.
•
CPU Load (Hz)—Processor load of the VM in the last polling period.
•
Memory Load—Amount of memory used by the VM in the last polling period.
•
More—Click More... to view the running status of all VMs. By default, the report displays the
running status of only the first 10 VMs when the VMware ESX server has more than 10 VMs.