Latch details, Access method details – H3C Technologies H3C Intelligent Management Center User Manual
Page 254
240
{
History Record—Click the History Record icon
to view the history graph of SQL statistics
trend. Point to a spot on the curve to view the trend of SQL statistics at the specific time point.
Authorized users can view SQL statistics over the last 1 hour, last 6 hours, today, yesterday, this
week, this month, and this year by clicking the corresponding icons on the upper right of the
graph.
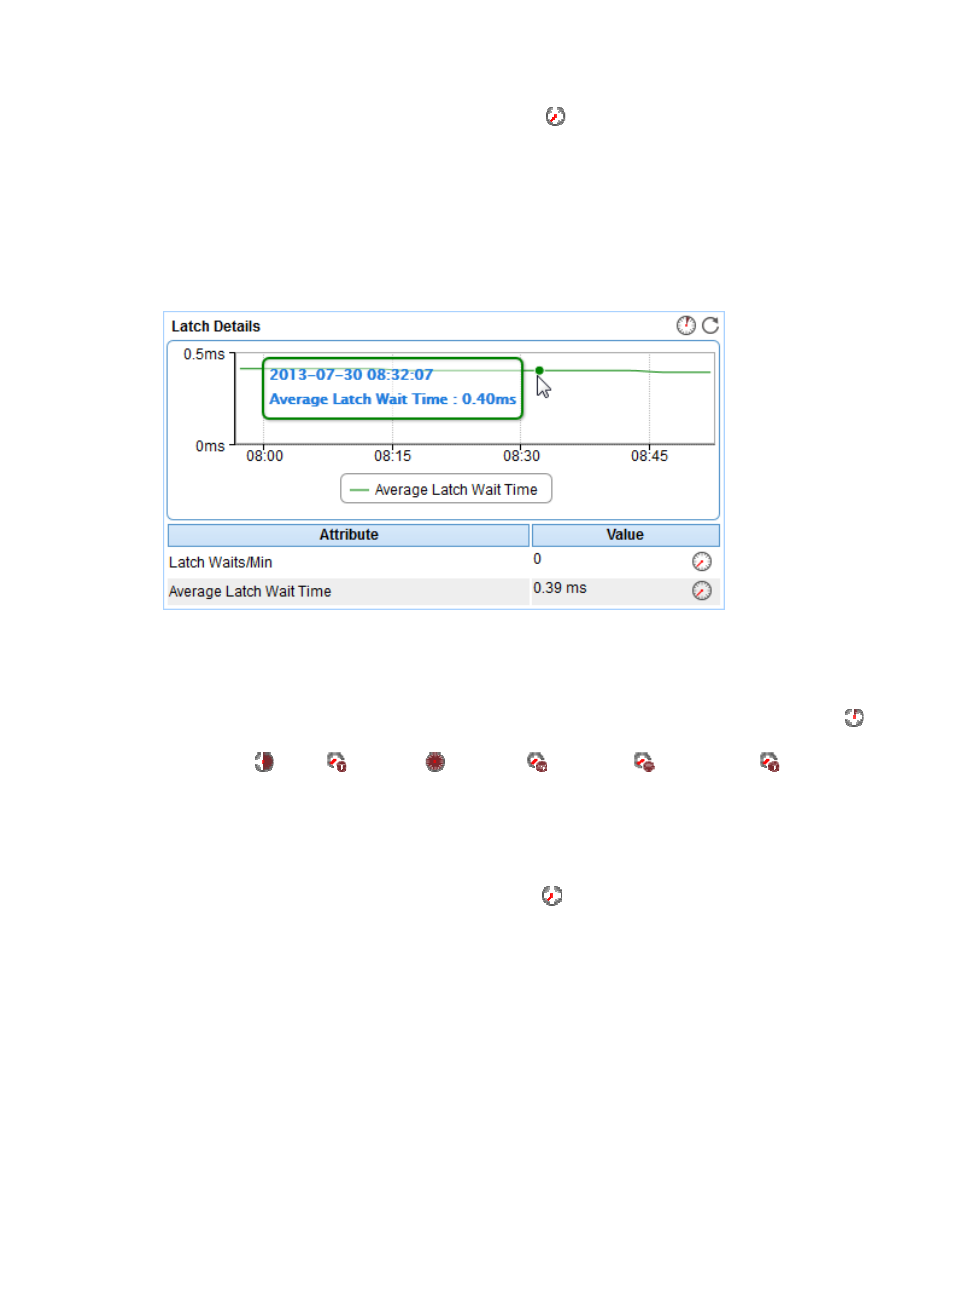
Latch Details
The Latch Details area layout is shown in
.
Figure 190 Latch Details area layout
Latch Details area fields:
•
Average Latch Wait Time trend graph—Shows the changes of the average latch waiting time of
SQL Server over the last 1 hour in a line chart. Point to a spot on the curve to view the average latch
waiting time at the specific time point. To change the report period, click the Last 1 Hour icon
on the upper right of the graph, and then select an icon from the list. Available options include Last
6 Hours
, Today
, Yesterday
, This Week
, This Month
, and This Year
.
•
Attribute/Value—Monitor index name and data that was obtained when APM last polled the SQL
Server.
{
Lock Waits/Min—Number of the waiting latch requests per second.
{
Average Latch Wait Time—Average waiting time (in millisecond) for latch requests.
{
History Record—Click the History Record icon
to view the average latch waiting time trend
of SQL Server. Point to a spot on the curve to view the average latch waiting time at the specific
time point. Authorized users can view the average latch waiting time statistics over the last 1
hour, last 6 hours, today, yesterday, this week, this month, and this year by clicking the
corresponding icons on the upper right of the graph.
Access Method Details
The Access Method Details area layout is shown in