Availability today – H3C Technologies H3C Intelligent Management Center User Manual
Page 423
409
Monitor Information area fields:
•
Name—Application monitor name.
•
Health State—Health state of PHP.
•
IP Address—IP address of the Web server which can parse PHP.
•
Application Type—Type of the monitored application, which is always PHP.
•
Port—Enter the port through which the Apache server provides Web services.
•
Last Polling Time—Time when APM last polled the PHP server.
•
Relationship icon
—Click the Related Applications icon
to view dependencies between PHP
and other applications in a dependency topology view. For more information about dependency
topologies, see "
4 Topology and application group management
•
Top5 Unrecovered Alarm—Latest five unrecovered alarms on PHP. This field does not appear if no
alarm is generated. The alarm level is identified by color: yellow for minor alarms, orange for major
alarms, and red for critical alarms.
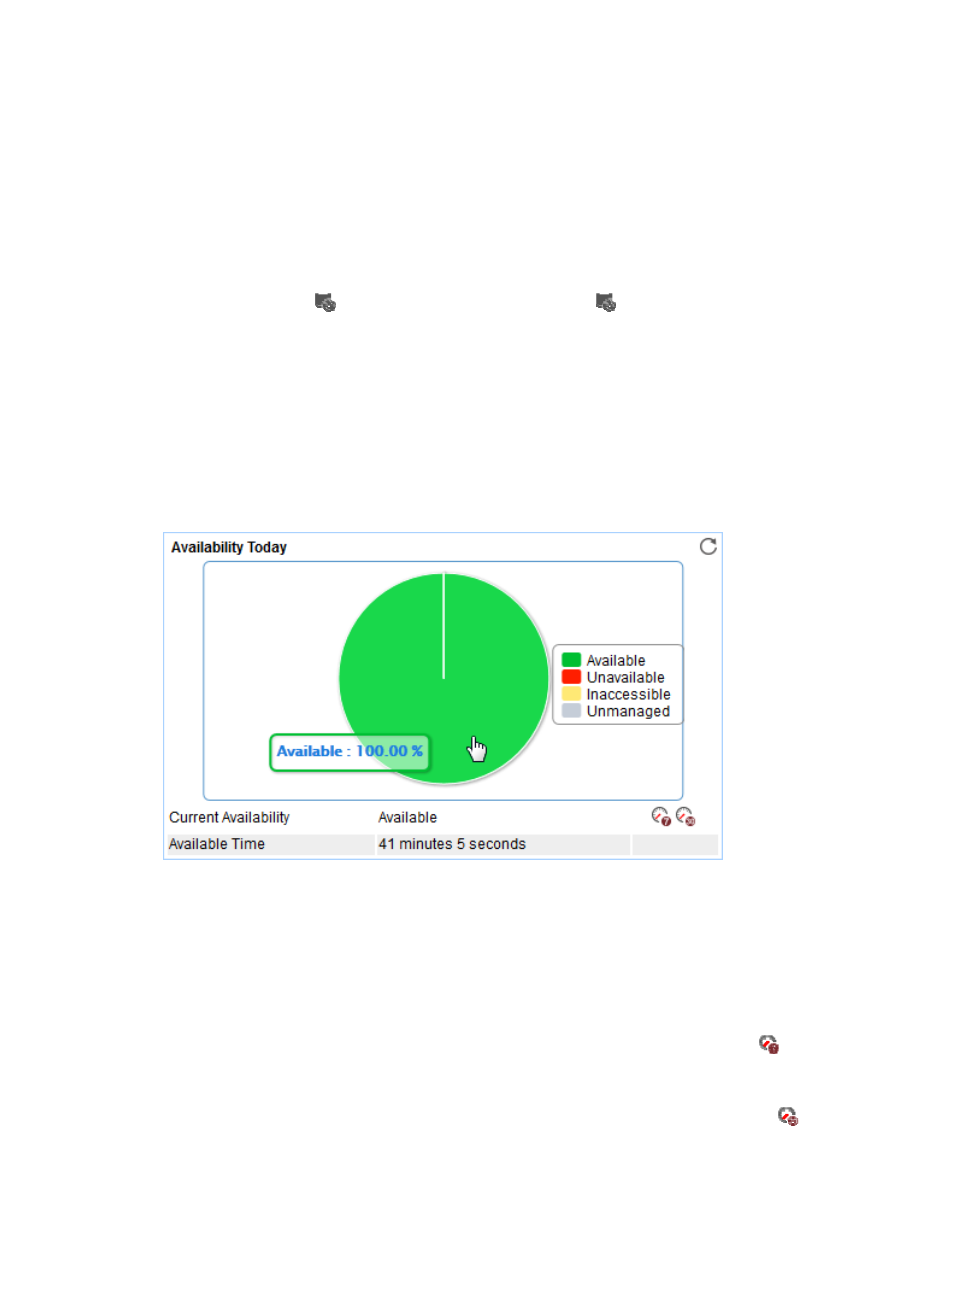
Availability Today
The Availability Today area layout is shown in
.
Figure 340 Availability Today area layout
Availability Today area fields:
•
Availability pie chart—Shows time duration percentages of the availability states
for PHP today.
The availability states include Available, Unavailable, Inaccessible, and Unmanaged. To view the
time duration percentage of a specific availability state, place the cursor over the corresponding
slice in the chart.
•
Current Availability—Availability of PHP when APM last polled PHP.
{
To view the availability of PHP in the last 7 days, click the Weekly History icon
. The weekly
availability data is collected hourly. To view the time duration percentages of availability states
at a specific time, place the cursor over that time.
{
To view the availability of PHP in the last 30 days, click the Monthly History icon
. The
monthly availability data is collected daily. To view the time duration percentages of availability
states on a specific day, place the cursor over that day.