Response time, Figure 230 – H3C Technologies H3C Intelligent Management Center User Manual
Page 292
278
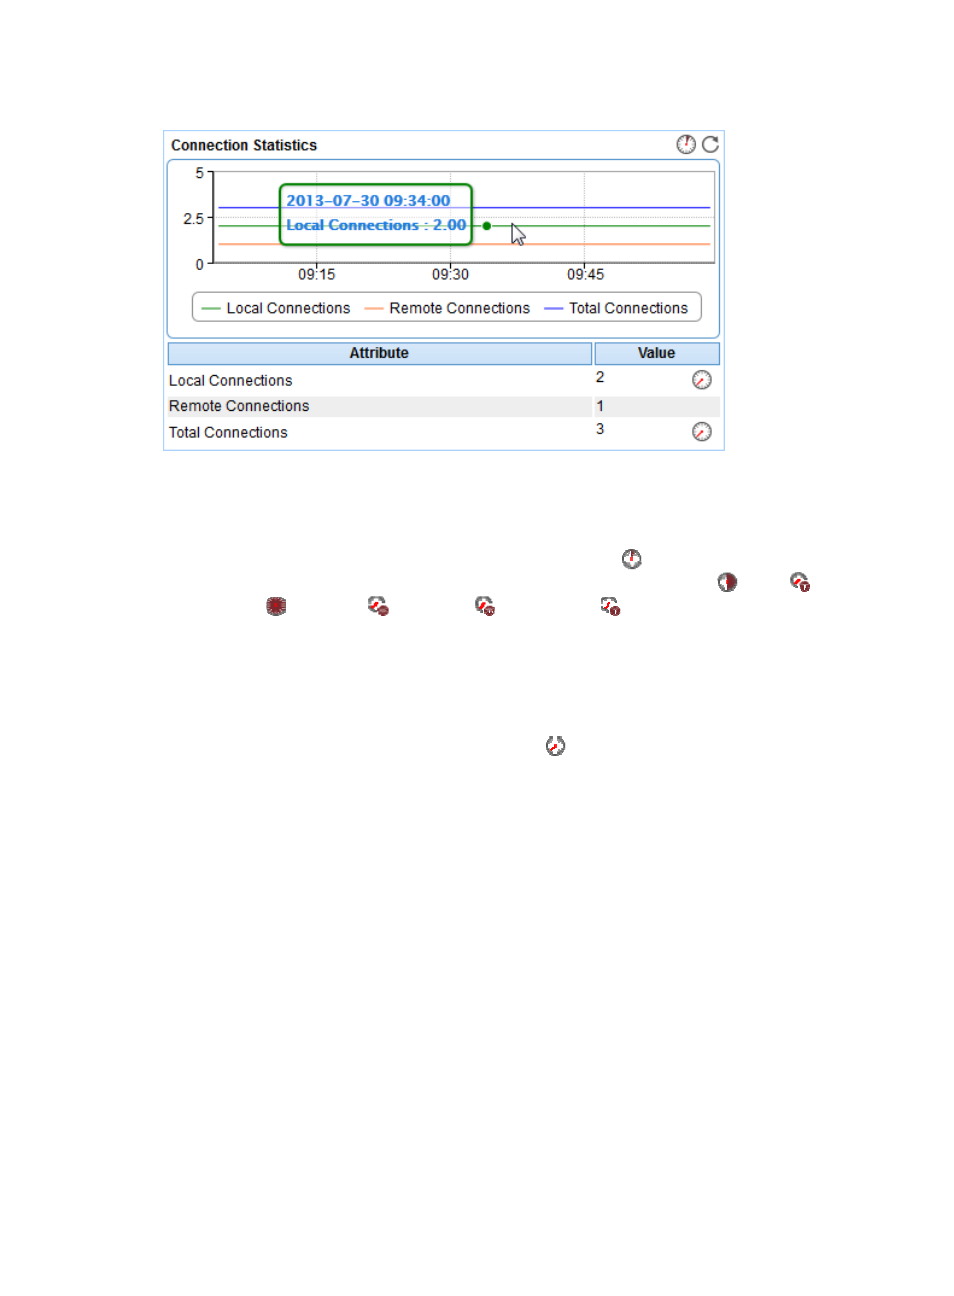
Figure 230 Connection Statistics area layout
Connection Statistics area fields:
•
Connection Statistics trend graph—Shows the trend of DB2 connection statistics over the last 1 hour
in a line chart. Point to a spot on the curve to view the DB2 connection statistics at the specific time
point. To change the report period, click the Last 1 Hour icon
on the upper right of the graph,
and then select an icon from the list. Available options include Last 6 Hours
, Today
,
Yesterday
, This Week
, This Month
, and This Year
.
•
Attribute/Value—Monitor index name and data that was obtained when APM last polled DB2.
{
Local Connections—Number of local connections of the DB2 instance.
{
Remote Connections—Number of remote connections of the DB2 instance.
{
Total Connections—Total number of local and remote connections of the DB2 instance.
{
History Record—Click the History Record icon
to view the history graph of the connection
statistics trend. Point to a spot on the curve to view the connection statistics at the specific time
point. Authorized users can view connection statistics over the last 1 hour, last 6 hours, today,
yesterday, this week, this month, and this year by clicking the corresponding icons on the upper
right of the graph.
Response Time
The Response Time area layout is shown in