Jvm heap memory details – H3C Technologies H3C Intelligent Management Center User Manual
Page 370
356
•
Availability pie chart—Shows time duration percentages of the availability states for the WebLogic
server today. The availability states include Available, Unavailable, Inaccessible, and Unmanaged.
To view the time duration percentage of a specific availability state, point to the corresponding slice
in the chart.
•
Current Availability—Availability of the WebLogic server in the last polling period.
{
To view the availability of the WebLogic server in the last 7 days, click the Weekly History icon
. The weekly availability data is collected hourly. To view the time duration percentages of
availability states at a specific time, point to that time.
{
To view the availability of the WebLogic server in the last 30 days, click the Monthly History
icon
. The monthly availability data is collected daily. To view the time duration percentages
of availability states on a specific day, point to that day.
•
Available Time—Total available time duration of the WebLogic server since 00:00 today.
•
Unavailable Time—Total unavailable time duration of the WebLogic server since 00:00 today.
•
Inaccessible Time—Total inaccessible time duration of the WebLogic server since 00:00 today.
•
Unmanaged Time—Total unmanaged time duration of the WebLogic server since 00:00 today.
Availability time statistics of a new application monitor are collected since 00:00 on the day when the
application monitor was added. An availability time field does not appear if its value is 0.
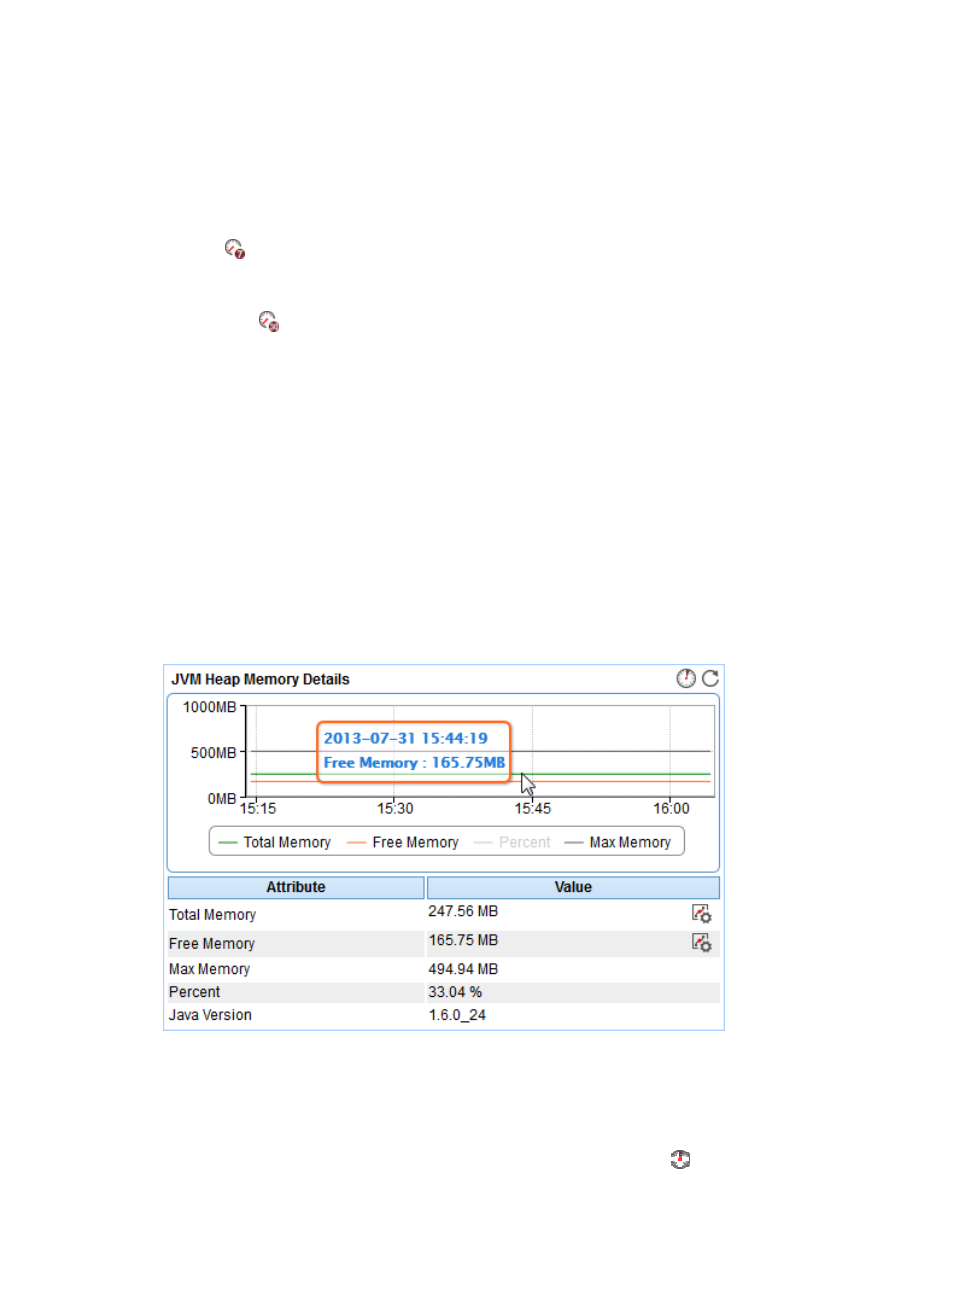
JVM Heap Memory Details
The normal operation of the WebLogic server relies on the performance of the Java virtual machine (JVM)
in which the server is running. APM monitors the JVM heap memory usage for the WebLogic server and
displays the monitoring details in the JVM Heap Memory Details area, as shown in
Figure 293 JVM Heap Memory Details area layout
JVM Heap Memory Details area fields:
•
JVM heap memory usage trend graph—Shows the JVM heap memory usage trend of the
WebLogic server over the selected time period in a line graph. Point to a spot in the curve to view
the JVM heap memory usage statistics at the specific time point. By default, the graph shows the last
1 hour data. To change the report period, click the Last 1 Hour icon
on the upper right of the