Connection information – H3C Technologies H3C Intelligent Management Center User Manual
Page 545
531
view the time duration percentage of a specific availability state, place the cursor over the
corresponding slice in the chart.
•
Current Availability—Availability of the FTP service in the last polling period.
{
To view the availability of the FTP service in the last 7 days, click the Weekly History icon
.
The weekly availability data is collected hourly. To view the time duration percentages of
availability states at a specific time, point to that time.
{
To view the availability of the FTP service in the last 30 days, click the Monthly History icon
.
The monthly availability data is collected daily. To view the time duration percentages of
availability states on a specific day, point to that day.
•
Available Time—Total available time duration of the FTP service since 00:00 today.
•
Unavailable Time—Total unavailable time duration of the FTP service since 00:00 today.
•
Inaccessible Time—Total inaccessible time duration of the FTP service since 00:00 today.
•
Unmanaged Time—Total unmanaged time duration of the FTP service since 00:00 today.
Availability time statistics of a new application monitor are collected since the application monitor was
added. An availability time field does not appear when its value is 0.
Connection Information
Typically, a host that provides FTP services is called an FTP server. APM attempts to connect to and sends
login requests to the FTP server in each polling period. The Connection Information area layout is shown
in
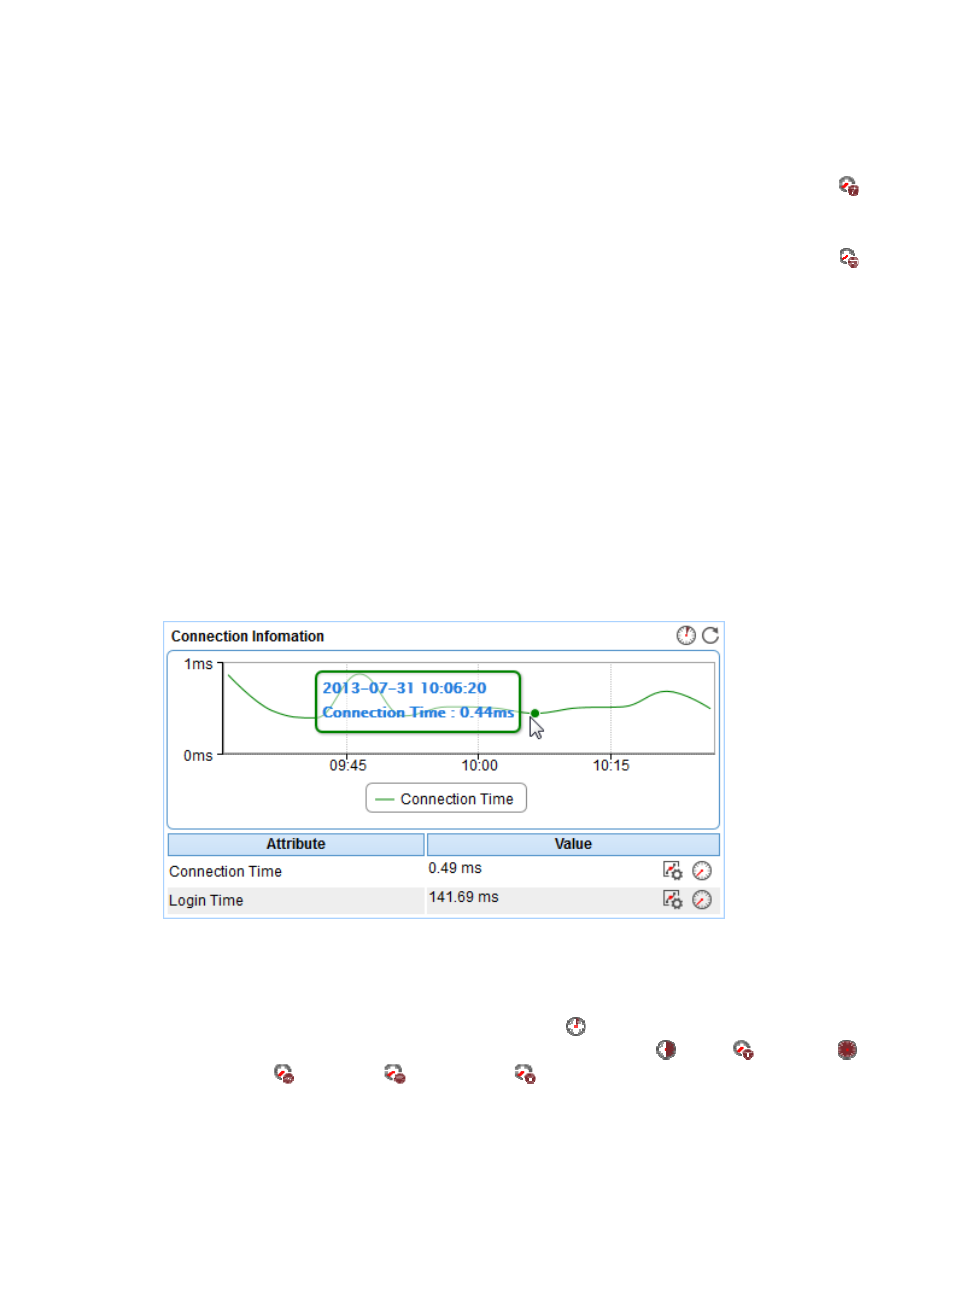
Figure 439 Connection Information area layout
Connection Information area fields:
•
Connection Time trend graph—Shows changes of the FTP connection time in the polling period
over the last 1 hour. Point to a spot on the curve to view the connection time at the specific time point.
To change the report period, click the Last 1 Hour icon
on the upper right of the graph, and then
select an icon from the list. Available options include Last 6 Hours
, Today
, Yesterday
,
This Week
, This Month
, and This Year
.
•
Attribute/Value—Monitor index name and data.
{
Connection Time—Shows how long it takes APM to last successfully connect to the FTP server.
{
Login Time—Shows how long it takes APM to last successfully log in the FTP server.