Background processing errors – H3C Technologies H3C Intelligent Management Center User Manual
Page 640
626
background processes and the orange curve shows the total number of SAP background processes.
Point to a spot on a curve to view data at the specific time point. View the changes in the numbers
of terminated and total SAP background processes over a specific time period by clicking the Last
1 Hour icon
, Last 6 Hours icon
, Today icon
, Yesterday icon
, This Week icon
,
This Month icon
, or This Year icon
. The graph shows the last hour data by default.
•
Attribute/Value—Monitor index name and data that was obtained when APM last polled SAP.
{
Terminated Processes—Number of background processes that were terminated due to an error.
{
Total Processes—Total number of processes in SAP background processing.
{
History Record—Click the History Record icon
to view the history trend graph of the
terminated or total background processes. Point to a spot on the curve to view data at the
specific time point. Authorized users can view terminated and total background process
statistics over the last 1 hour, last 6 hours, today, yesterday, this week, this month, and this year
by clicking the corresponding icons on the graph.
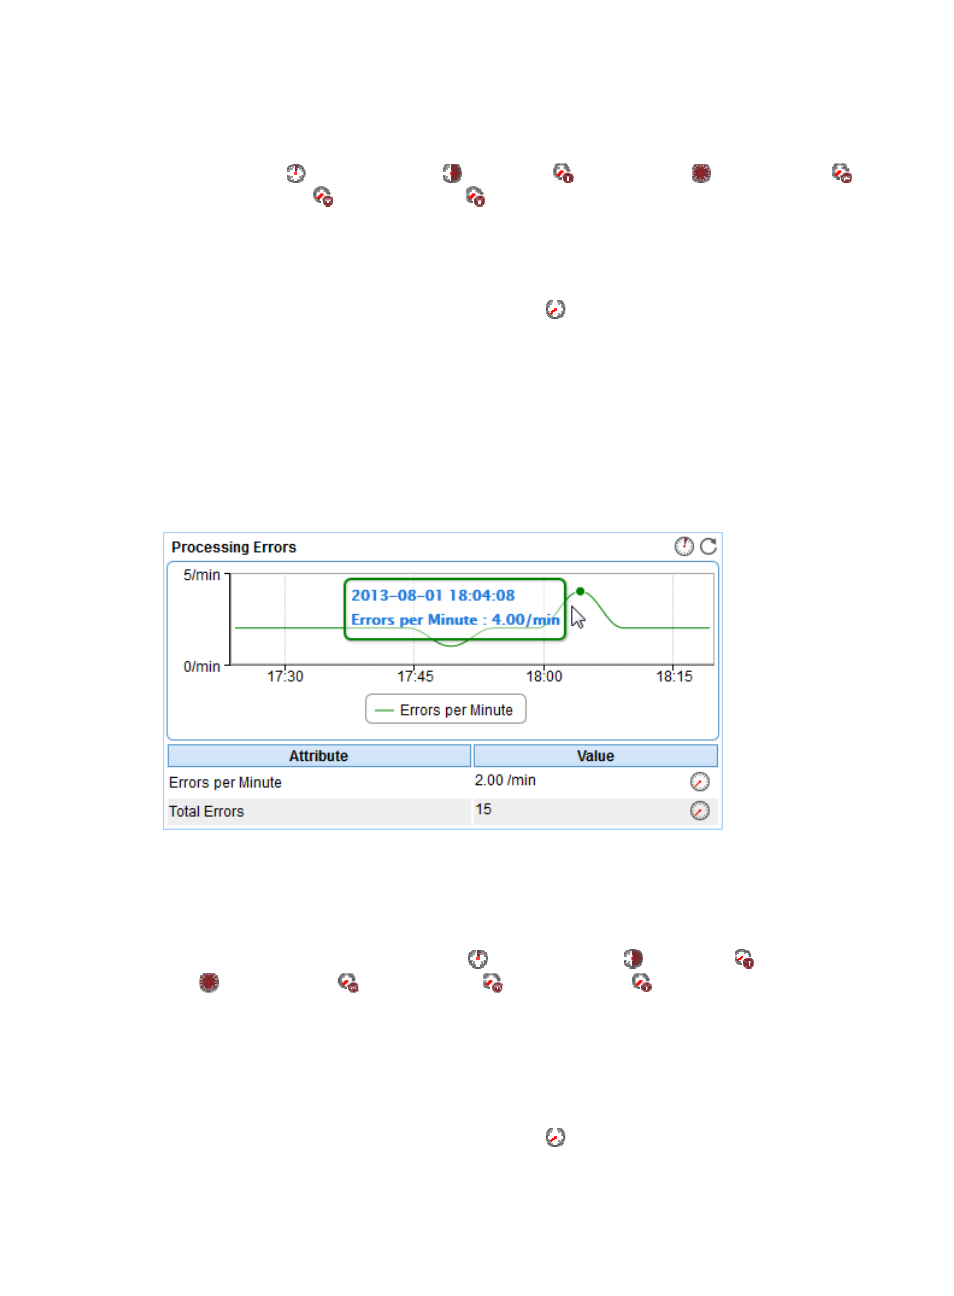
Background Processing Errors
The Background Processing Errors area is located on the Background tab and its layout is shown
in
Figure 529 Background Processing Errors area layout
Background Processing Errors area fields:
•
Trend graph—Shows the changes of the background processing error rate of the SAP application
in a line chart. Point to a spot on the curve to view the background processing error rate at the
specific time point. View the changes of the background processing error rate over a specific time
period by clicking the Last 1 Hour icon
, Last 6 Hours icon
, Today icon
, Yesterday icon
, This Week icon
, This Month icon
, or This Year icon
. The graph shows the last hour
data by default.
•
Attribute/Value—Monitor index name and data that was obtained when APM last polled SAP.
{
Errors per Minute—Average number of errors that occur in SAP background processing per
minute.
{
Total Errors—Total number of errors that have occurred in SAP background processing.
{
History Record—Click the History Record icon
to view the history trend graph of the
background processing error rate or total errors. Point to a spot on the curve to view data at the
specific time point. Authorized users can view background processing error rate and total error