File system usage ratio – H3C Technologies H3C Intelligent Management Center User Manual
Page 197
183
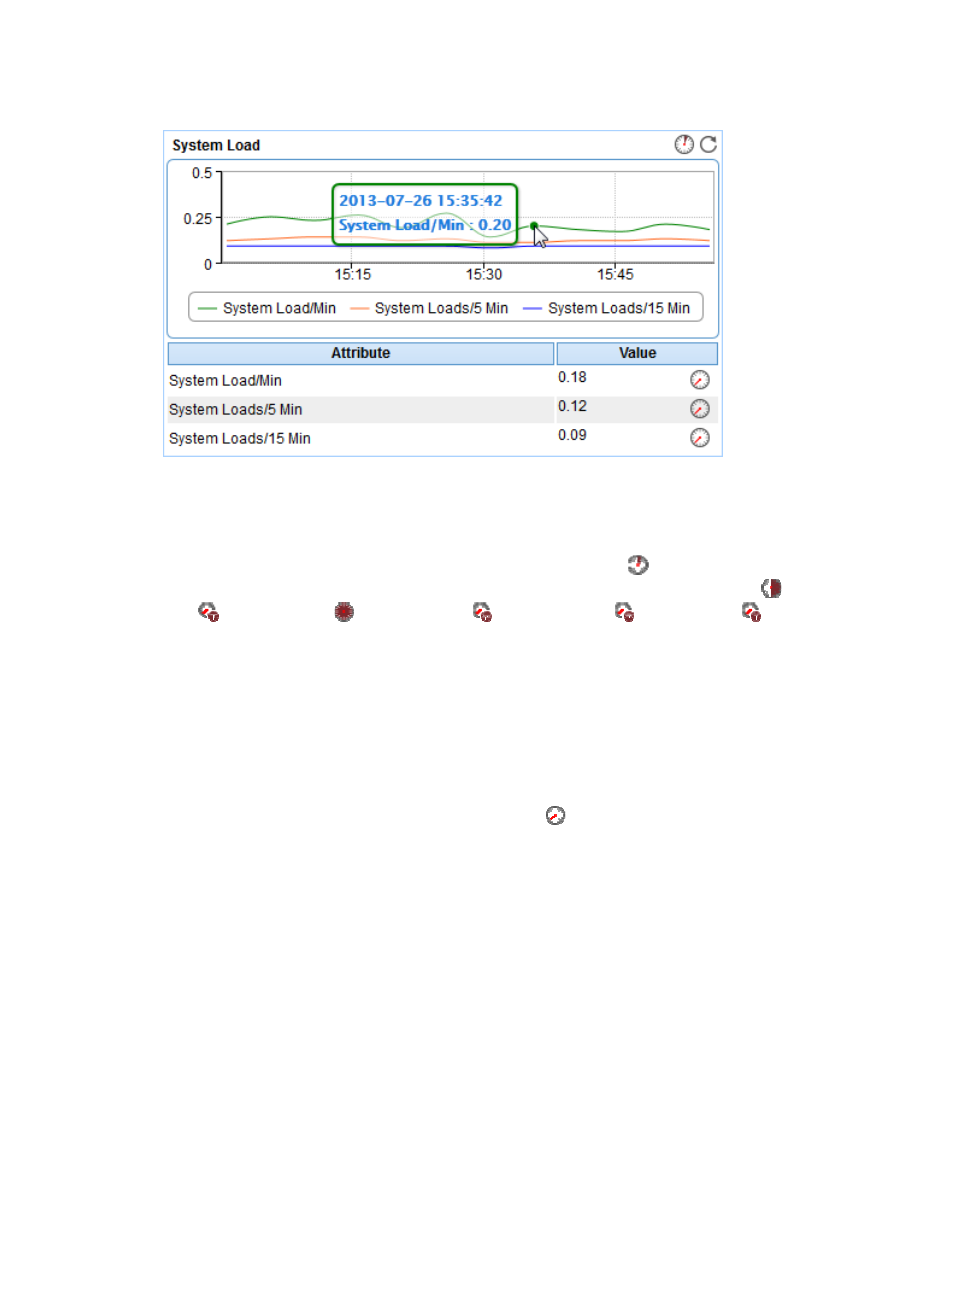
Figure 132 System Load area layout
System Load area fields:
•
System Load trend graph—Shows the system load trend of OpenBSD over the last 1 hour. The
green curve shows the system load over 1 minute, the orange over 5 minutes, and the blue over 15
minutes. To change the report period, click the Last 1 Hour icon
on the upper right of the graph,
and then select an icon from the list. Available options include the Last 6 Hours icon
, Today icon
, Yesterday icon
, This Week icon ,
This Month icon
, and This Year
. Point to a spot
on the curve to view the system load at the specific time point. Click the legend names to display or
hide the corresponding monitor indexes.
•
Attribute/Value—Monitor index name and data that was obtained when APM last polled
OpenBSD.
{
System Load/Min—Average system load over the last 1 minute.
{
System Load/5 Min—Average system load over the last 5 minutes.
{
System Load/15 Min—Average system load over the last 15 minutes.
{
History Record—Click the History Record icon
to view the history graph of the average
system load trend. Point to a spot on the curve to view the data at the specific time point.
Authorized users can view system load statistics over the last 1 hour, last 6 hours, today,
yesterday, this week, this month, and this year by clicking the corresponding icons.
File System Usage Ratio
The OpenBSD file directory structure contains one root directory and multiple subdirectories. File systems
are mounted to the root directory or subdirectories under the root directory. Each file system corresponds
to a physical disk partition or logical volume. Use the File System Usage Ratio area to display how the
available disk space is used. Its area layout is shown in