Error log, Process – H3C Technologies H3C Intelligent Management Center User Manual
Page 219
205
•
Interface Name—Identifier of a network interface card in HP-UX. APM monitors both physical and
virtual (logical) network interface cards.
•
Output Packet Rate—Number of outbound packets per second on the network interface card in the
last APM polling period.
Set Threshold—Click the Set Threshold icon
to set alarm thresholds for the output packet rate of
HP-UX network interface cards. The data is highlighted in orange when the receive rate reaches
the level-1 threshold, and is highlighted in red when the receive rate reaches the level-2 threshold.
Use the global thresholds or custom thresholds. For information about setting the thresholds, see "
."
•
Input Packet Rate—Number of inbound packets per second on the network interface card in the last
APM polling period.
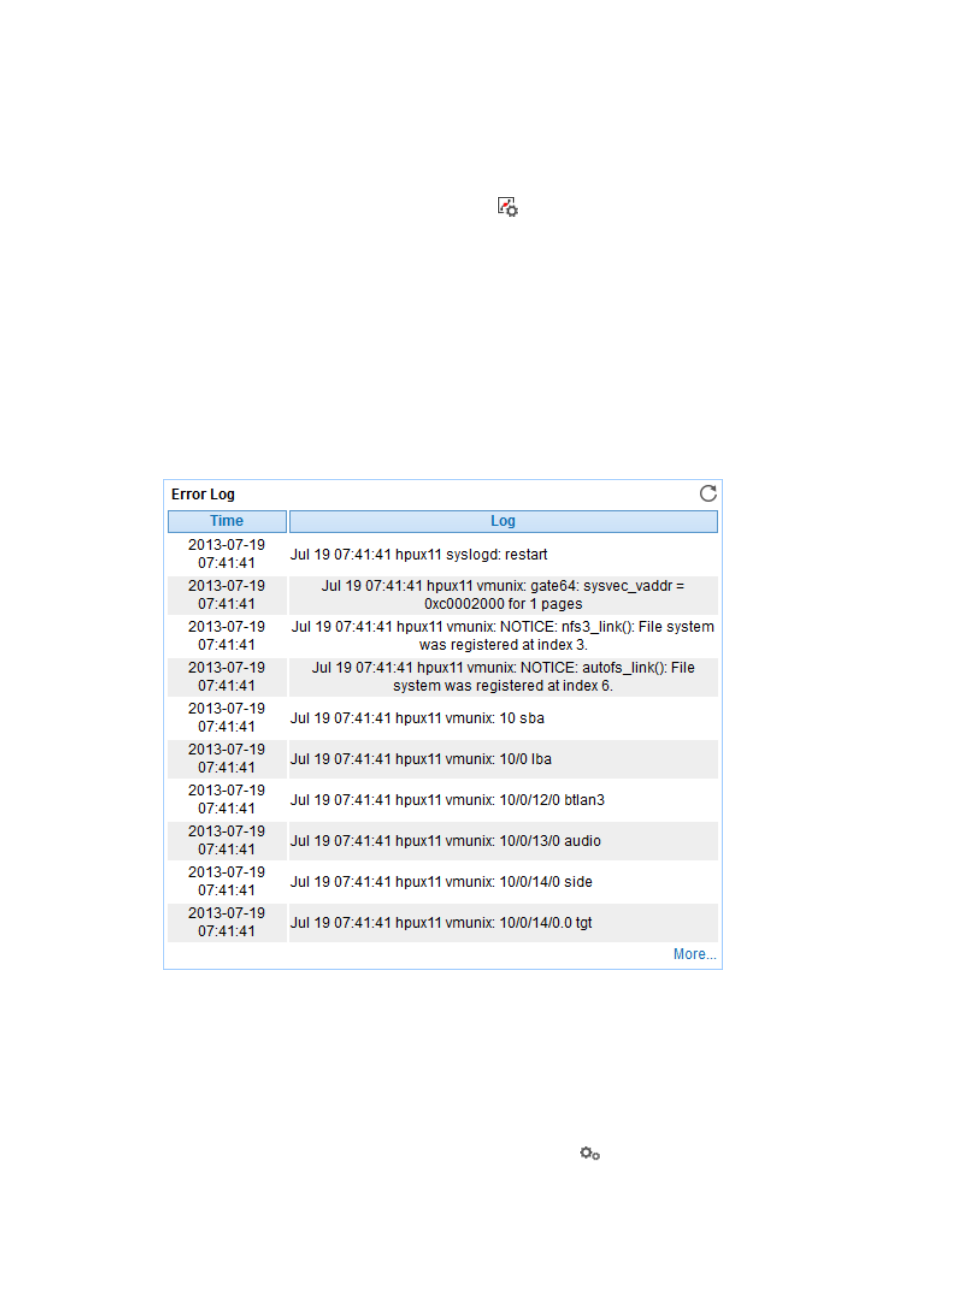
Error Log
APM examines the HP-UX error logs during polling and displays the first 10 error logs obtained in the
HP-UX application monitor report. The Error Log area layout is shown in
.
Figure 156 Error Log area layout
Error Log area fields:
•
Time—Time when the error occurred.
•
Log—Content of the error log.
•
More—Click the More to view all error logs in last polling of the HP-UX system.
Process
To monitor the process on HP-UX, click the Configuration icon
to select the processes to be monitored.
APM collects the index data for the monitored processes during the next host polling, which includes the