Thread details, Figure 200 – H3C Technologies H3C Intelligent Management Center User Manual
Page 264
250
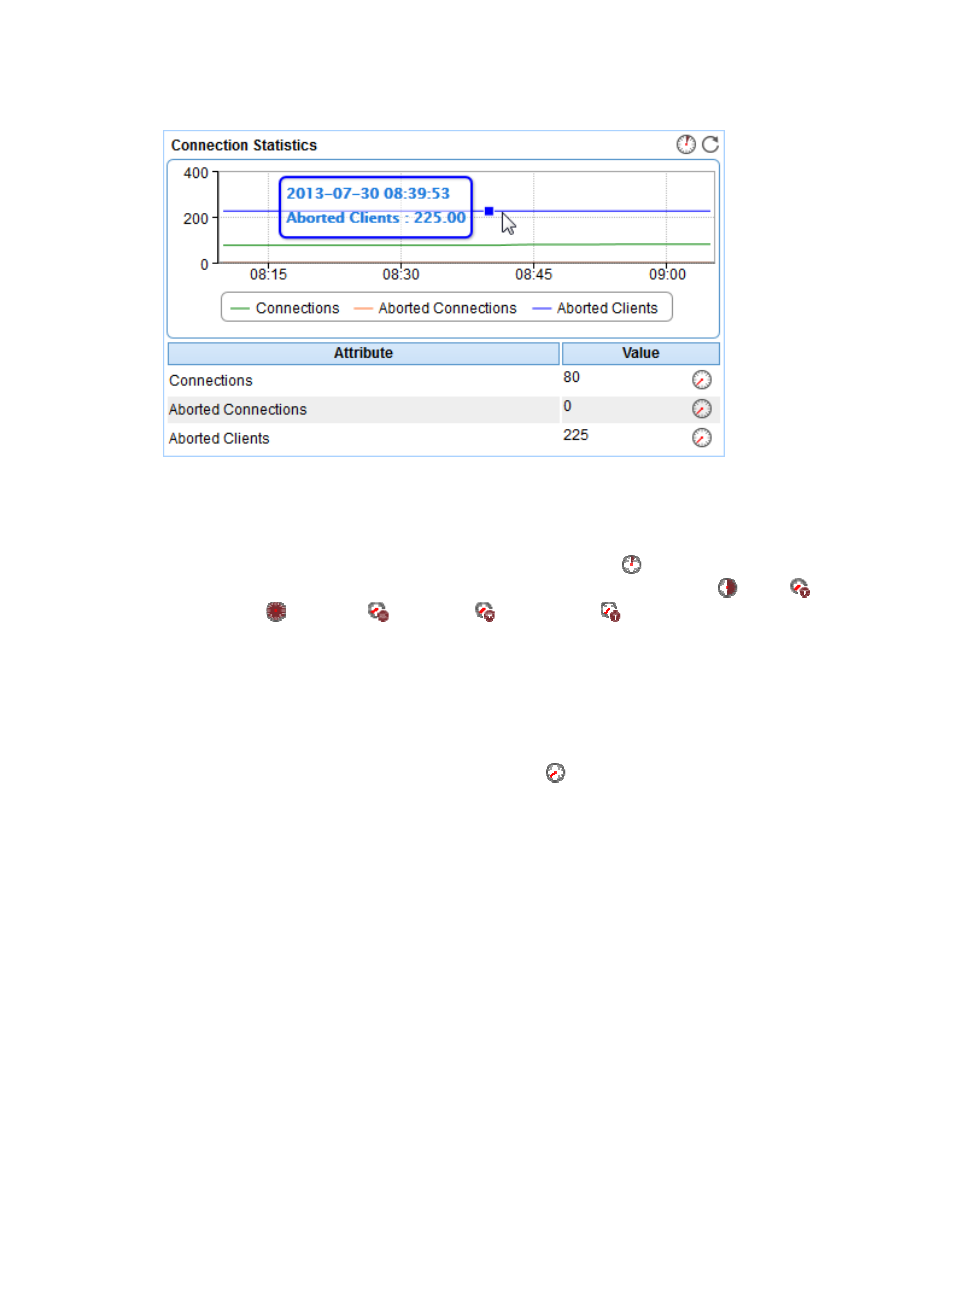
Figure 200 Connection Statistics area layout
Connection Statistics area field:
•
Request Statistics trend graph—Shows the changes of MySQL connection statistics over the last 1
hour in a line chart. Point to a spot on the curve to view the connection statistics at the specific time
point. To change the report period, click the Last 1 Hour icon
on the upper right of the graph,
and then select an icon from the list. Available options include Last 6 Hours
, Today
,
Yesterday
, This Week
, This Month
, and This Year
.
•
Attribute/Value—Monitor index name and data that was obtained when APM last polled MySQL.
{
Connections—Total number of successful connections since MySQL started.
{
Aborted Connections—Total number of failed connections since MySQL started.
{
Aborted Clients—Total number of aborted connections due to the clients terminating the
connections exceptionally since MySQL started.
{
History Record—Click the History Record icon
to view the history graph of the connection
statistics trend. Point to a spot on the curve to view the connection statistics at the specific time
point. Authorized users can view connection statistics over the last 1 hour, last 6 hours, today,
yesterday, this week, this month, and this year by clicking the corresponding icons on the upper
right of the graph.
Thread Details
The Thread Details area layout is shown in