Office search collector – H3C Technologies H3C Intelligent Management Center User Manual
Page 608
594
{
History Record—Click the History Record icon
to view the history trend graph of the
corresponding index. Point to a spot on the curve to view the monitor data at the specific time
point. Authorized users can view statistics over the last 1 hour, last 6 hours, today, yesterday, this
week, this month, and this year by clicking the corresponding icons on the upper right of the
graph.
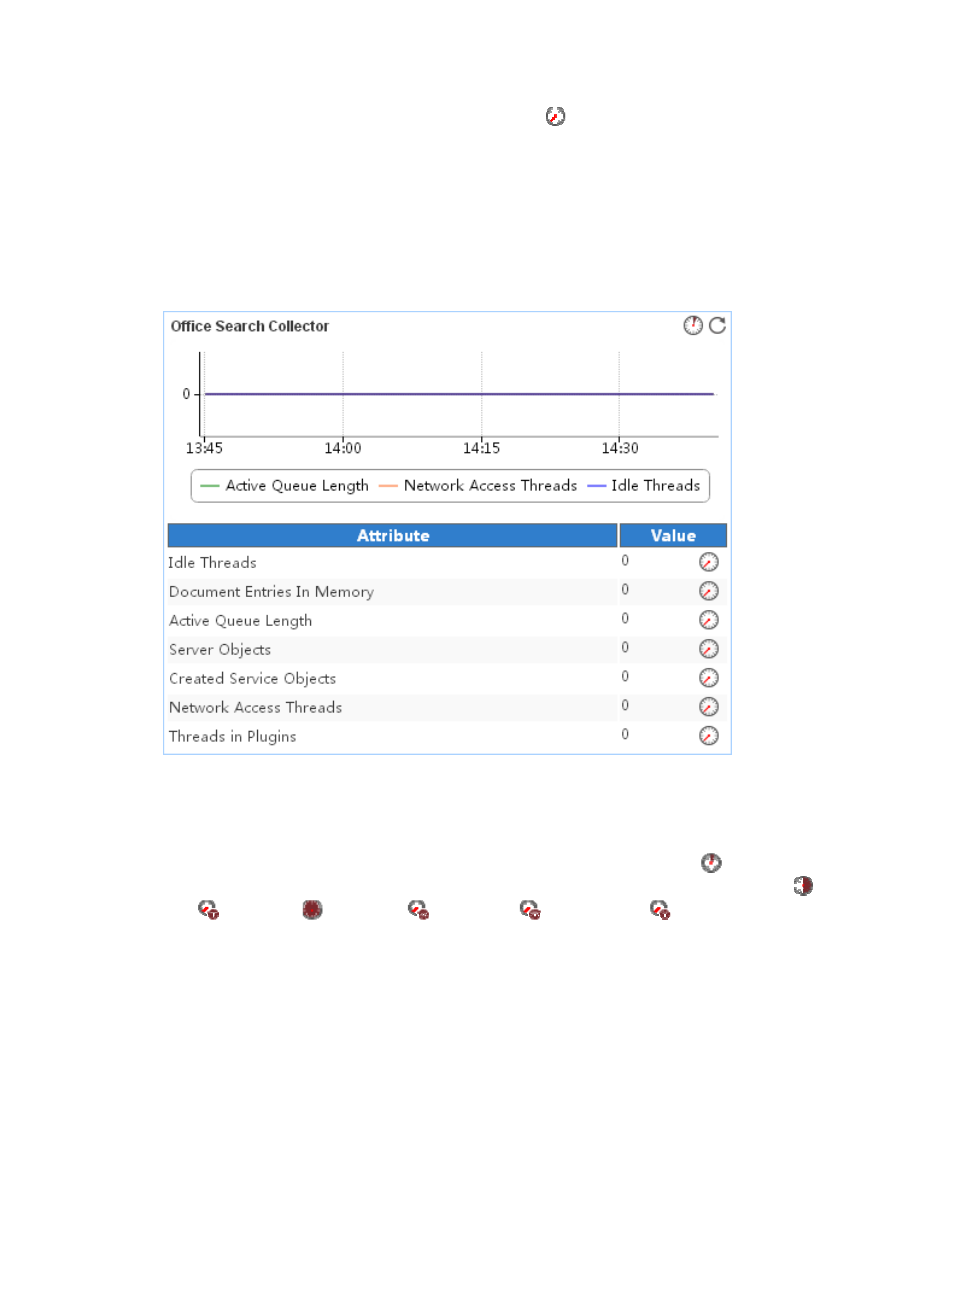
Office Search Collector
The Office Search Collector area layout is shown in
Figure 499 Office Search Collector area layout
Office Search Collector area fields:
•
Office Search Collector trend graph—Shows changes of the Office search collector related index
data over the last 1 hour in a line chart. Point to a spot on the curve to view the monitor data at the
specific time point. To change the report period, click the Last 1 Hour icon
on the upper right of
the graph, and then select an icon from the list. Available options include Last 6 Hours
, Today
, Yesterday
, This Week
, This Month
, and This Year
. Click the legend names to
display or hide the corresponding monitor indexes in the graph.
•
Attribute/Value—Monitor index name and data that was obtained when APM last polled Office
SharePoint 2013.
{
Idle Threads—Number of threads possessed by the Office search collector and waiting for
documents.
{
Document Entries In Memory—Number of document entries in the memory of the Office search
collector.
{
Active Queue Length—Number of documents waiting for robot threads in the Office search
collector.
{
Server Objects—Number of servers accessed by the Office search collector during a crawl.
Office SharePoint 2013 creates a server object for a server being accessed for the first time.