Application traffic – H3C Technologies H3C Intelligent Management Center User Manual
Page 394
380
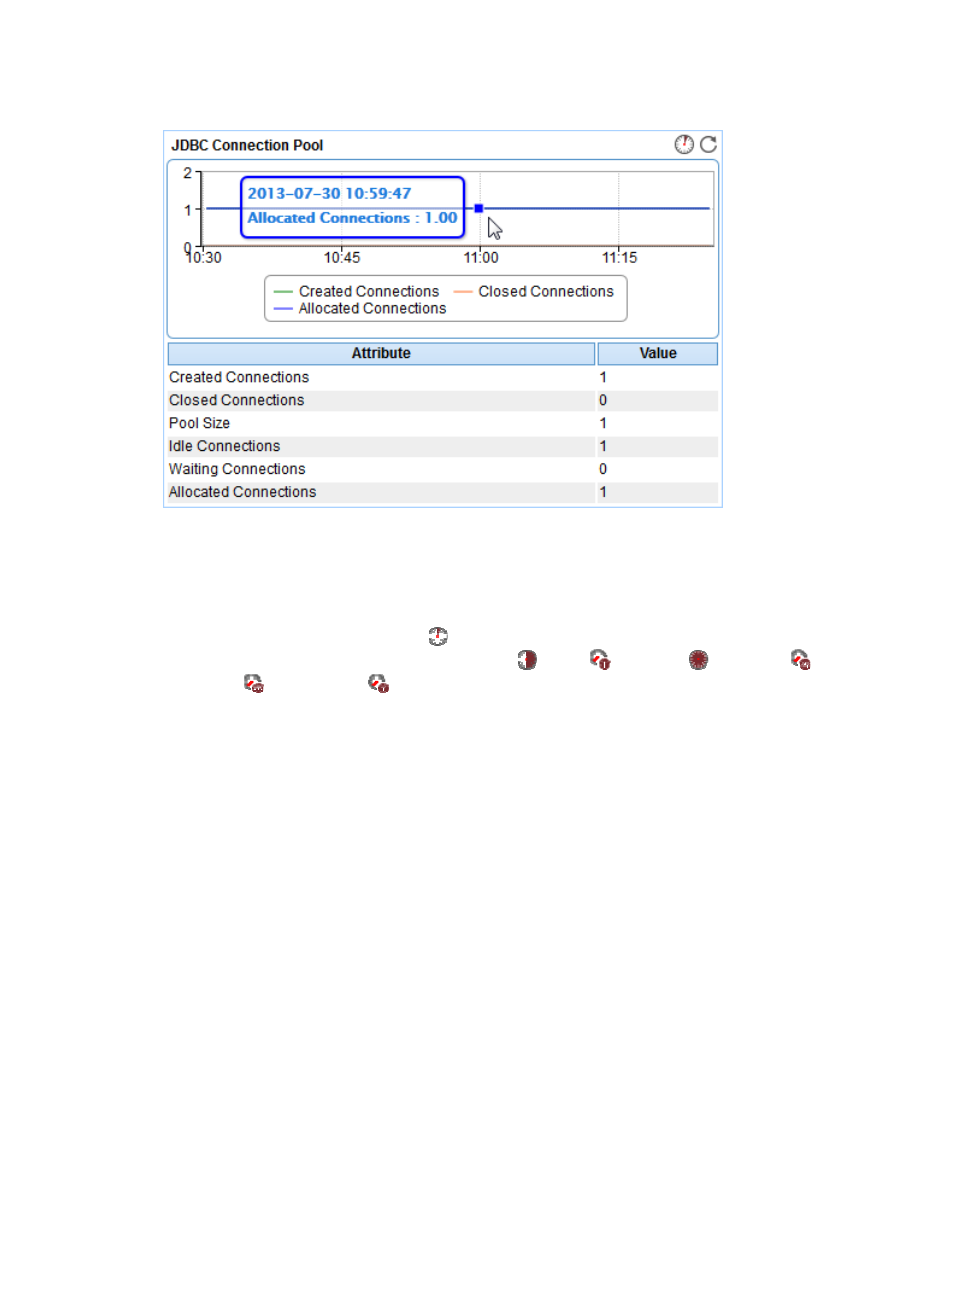
Figure 320 JDBC Connection Pool area layout
JDBC Connection Pool area fields:
•
Trend graph—Shows changes of the numbers of created connections, closed connections, and
allocated connections in the JDBC connection pool over the last 1 hour in a line graph. Point to a
spot in the curve to view the transaction statistics at the specific time point. To change the report
period, click the Last 1 Hour icon
on the upper right of the graph, and then select an icon from
the list. Available options include Last 6 Hours
, Today
, Yesterday
, This Week
, This
Month
, and This Year
. Click Created Connections, Closed Connections, or Allocated
Connections to display or hide the corresponding monitor index in the graph.
•
Attribute/Value—Monitor index name and data.
{
Created Connections—Total number of connections created since the WebSphere server
started until the last polling interval.
{
Closed Connections—Total number of connections closed since the WebSphere server started
until the last polling interval.
{
Pool Size—Size of the connection pool in the last polling interval.
{
Idle Connections—Total number of idle connections in the last polling interval.
{
Waiting Connections—Total number of connections in waiting state in the last polling interval.
{
Allocated Connections—Total number of allocated connections in the last polling interval.
Application Traffic
The Application Traffic area layout is shown in
. APM collects the traffic statistics of the
WebSphere server based on the IP address and port number of the WebSphere server host.