Memory usage ratio – H3C Technologies H3C Intelligent Management Center User Manual
Page 99
85
thresholds or custom thresholds. For information about setting thresholds, see "
{
History Record—Click the History Record icon
to view statistics of the history CPU usage
trend for the Windows operating system in a line graph. By default, the graph shows the last
hour statistics. To change the report period, click the Last 6 Hours icon ,
Today icon ,
Yesterday icon ,
This Week icon ,
This Month icon ,
or
This Year icon
on the upper
right of the graph as needed.
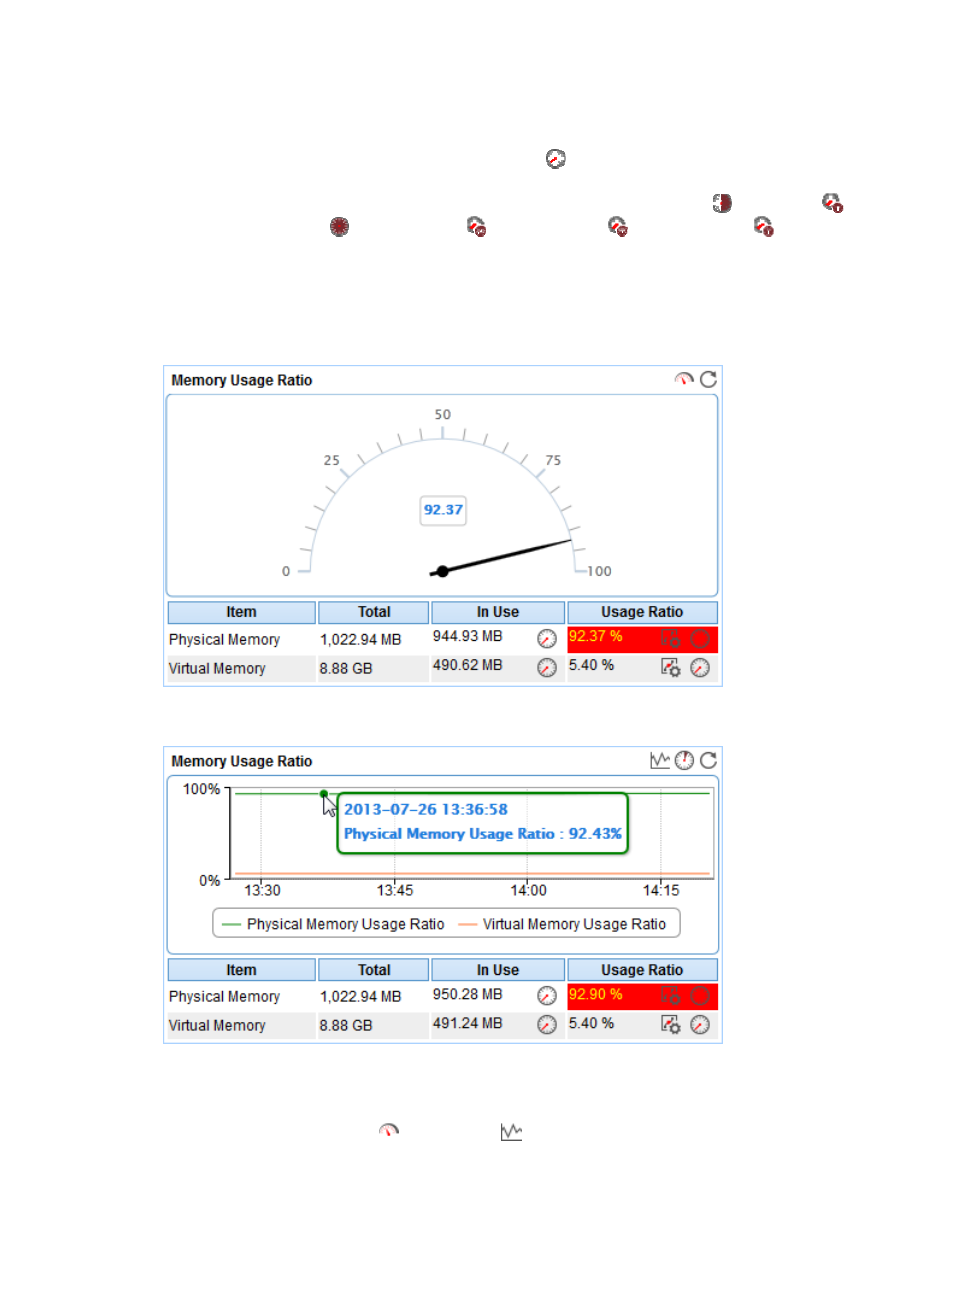
Memory Usage Ratio
The Memory Usage Ratio area is shown in a dashboard (see
).
Figure 37 Memory Usage Ratio—Dashboard area layout
Figure 38 Memory Usage Ratio—Trend graph area layout
Memory Usage Ratio area fields:
•
Memory Usage Ratio dashboard or trend graph—View the area in a dashboard or a trend graph.
Click the Dashboard icon
or Trend icon
in the top right corner to switch between the
graphs.