N in, Figure 398 – H3C Technologies H3C Intelligent Management Center User Manual
Page 492
478
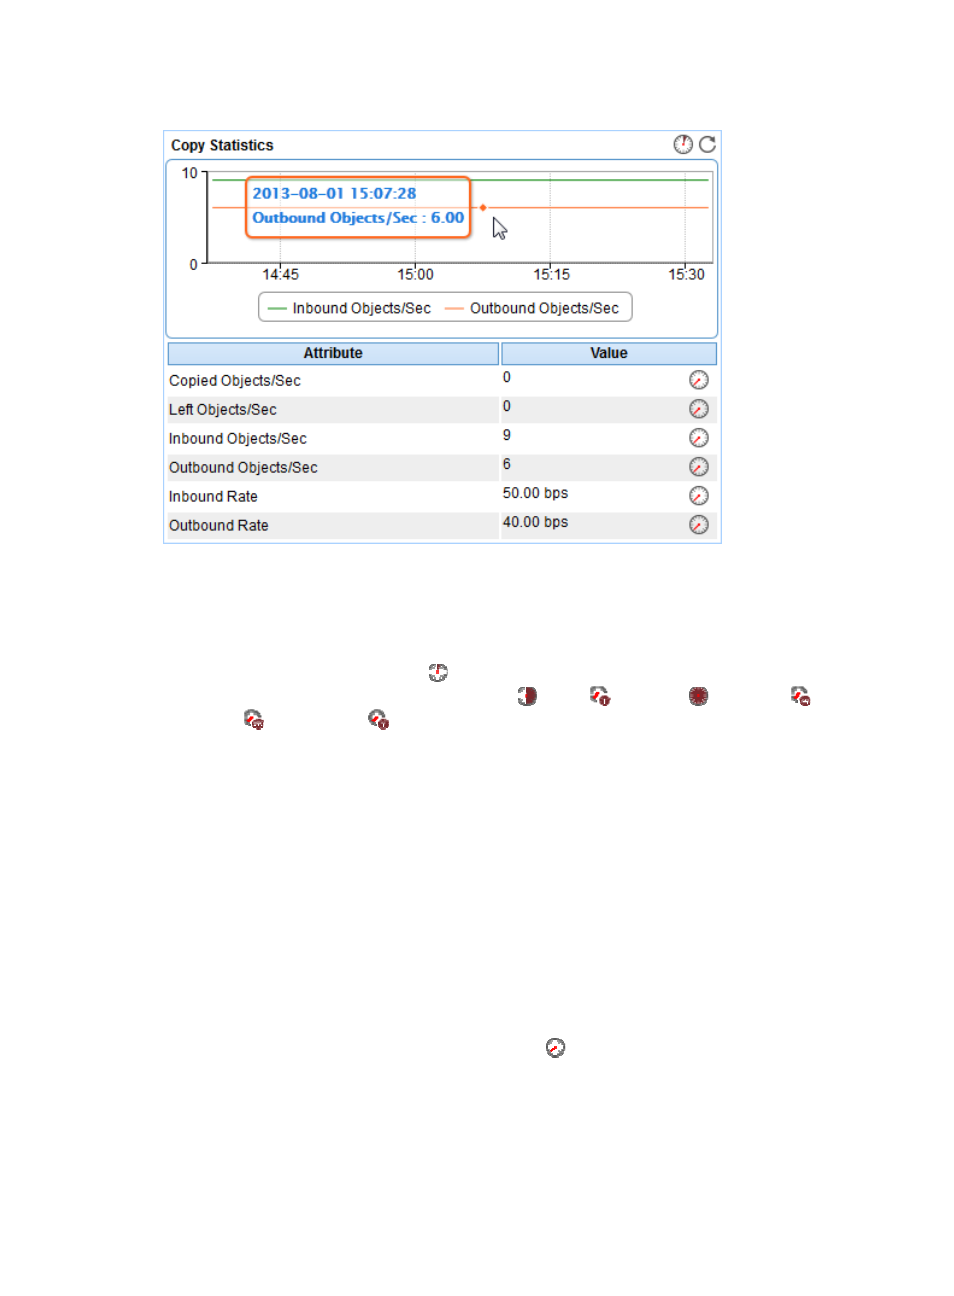
Figure 398 Copy Statistics area layout
Copy Statistics area fields:
•
Inbound/Outbound object trend graph—Shows changes of the number of inbound/outbound
objects per second over the last 1 hour in a line chart. Point to a spot on the curve to view the
number of inbound/outbound objects per second at the specific time point. To change the report
period, click the Last 1 Hour icon
on the upper right of the graph, and then select an icon from
the list. Available options include Last 6 Hours
, Today
, Yesterday
, This Week
, This
Month
, and This Year
.
•
Attribute/Value—Monitor index name and data.
{
Copied Objects/Sec—Rate at which replication updates received from ADs are applied by the
local AD in the last APM polling period. This counter excludes changes that are received but not
applied.
{
Left Objects/Sec—Number of object updates received in the current directory replication
update packet that have not yet been applied to the local AD in the last APM polling period.
{
Inbound Objects/Sec—Number of objects received per second from other ADs through
inbound replication in the last APM polling period.
{
Outbound Objects/Sec—Number of objects sent per second to other ADs through outbound
replication in the last APM polling period.
{
Inbound Rate—Inbound replication rate of the current AD in the last APM polling period.
{
Outbound Rate—Outbound replication rate of the current AD in the last APM polling period.
{
History Record—Click the History Record icon
to view the history graph of the replication
statistics trend. Point to a spot on the curve to view the replication statistics at the specific time
point. Authorized users can view the replication statistics over the last 1 hour, last 6 hours, today,
yesterday, this week, this month, and this year by clicking the corresponding icons on the upper
right of the graph.