Monitor information – H3C Technologies H3C Intelligent Management Center User Manual
Page 624

610
5.
Click OK.
Viewing the WebSphere MQ application monitor report
After adding the WebSphere MQ application monitor, APM collects application index data to calculate
its availability and health status. Obtain monitor indexes for WebSphere MQ by viewing the monitor
report.
To access the WebSphere MQ application monitor report:
1.
Click the Resource tab.
2.
Select Application Manager > Application Monitor from the navigation tree.
The application monitor list page displays all application monitors.
3.
Click the link identifying a WebSphere MQ application monitor.
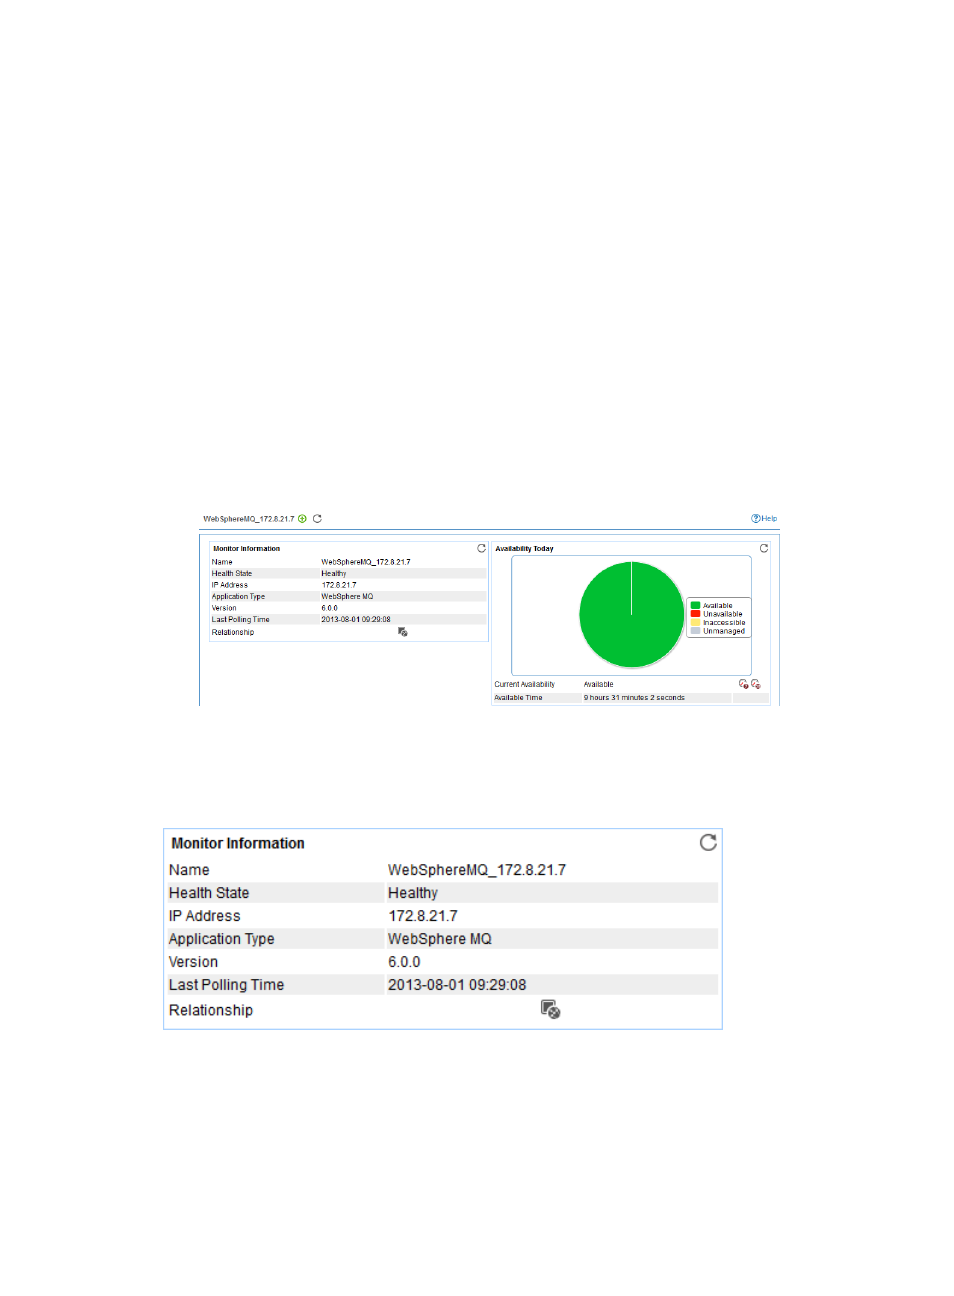
The WebSphere MQ monitor report appears, as shown in
. For information about the
icons in the monitor report, see "
." This section describes the fields in each area of the
monitor report.
Figure 511 Part of a WebSphere MQ application monitor report
Monitor Information
The Monitor Information area layout is shown in
Figure 512 Monitor Information area layout
Monitor Information area fields:
•
Name—Application monitor name.
•
Health State—Health status of the WebSphere MQ application.
•
IP Address—IP address of the WebSphere MQ host.
•
Application Type—Type of the monitored application, which is always WebSphere MQ.