H3C Technologies H3C Intelligent Management Center User Manual
Page 39
Advertising
25
Click the History Record icon to view the history trend for the application in a line graph. The time
range can be Last 1 Hour (
), Last 6 Hours (
), Today (
), Yesterday (
), This Week (
),
This Month (
), or This Year (
).
{
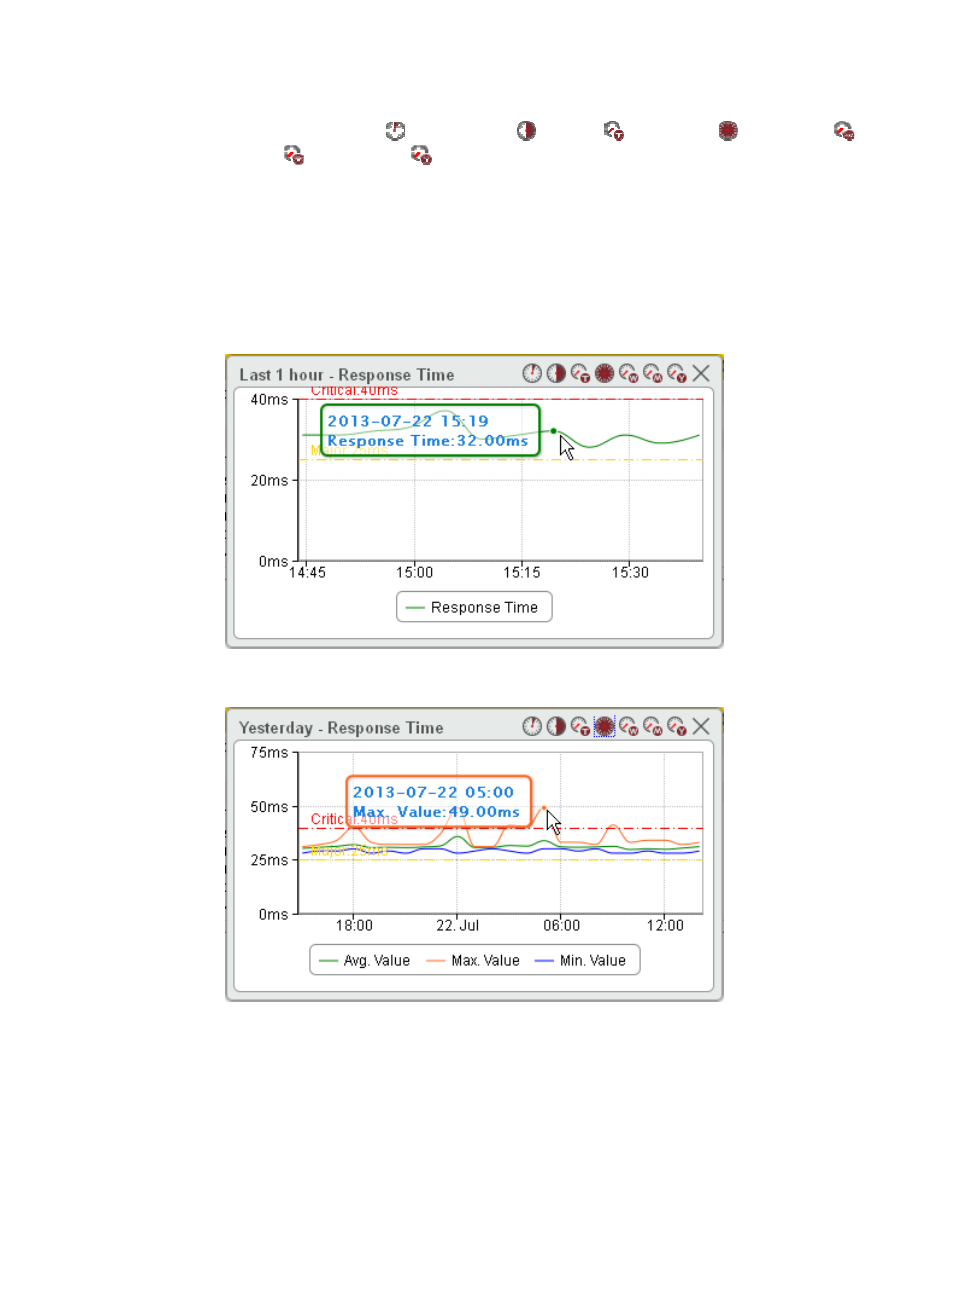
Hourly data, last 6 hours' data, and today's data are collected every polling interval.
shows the trend in last 1 hour.
{
Yesterday's, weekly, and monthly data are collected hourly. The statistics graph also displays
the maximum, minimum, and average values.
shows yesterday's trend.
{
Yearly data is collected daily. The statistics graph also displays the maximum, minimum, and
average values.
shows this year's trend.
Figure 15 Trend in last 1 hour
Figure 16 Yesterday's trend
Advertising