Sap system work queue, Dialog network response time – H3C Technologies H3C Intelligent Management Center User Manual
Page 641
627
statistics over the last 1 hour, last 6 hours, today, yesterday, this week, this month, and this year
by clicking the corresponding icons on the graph.
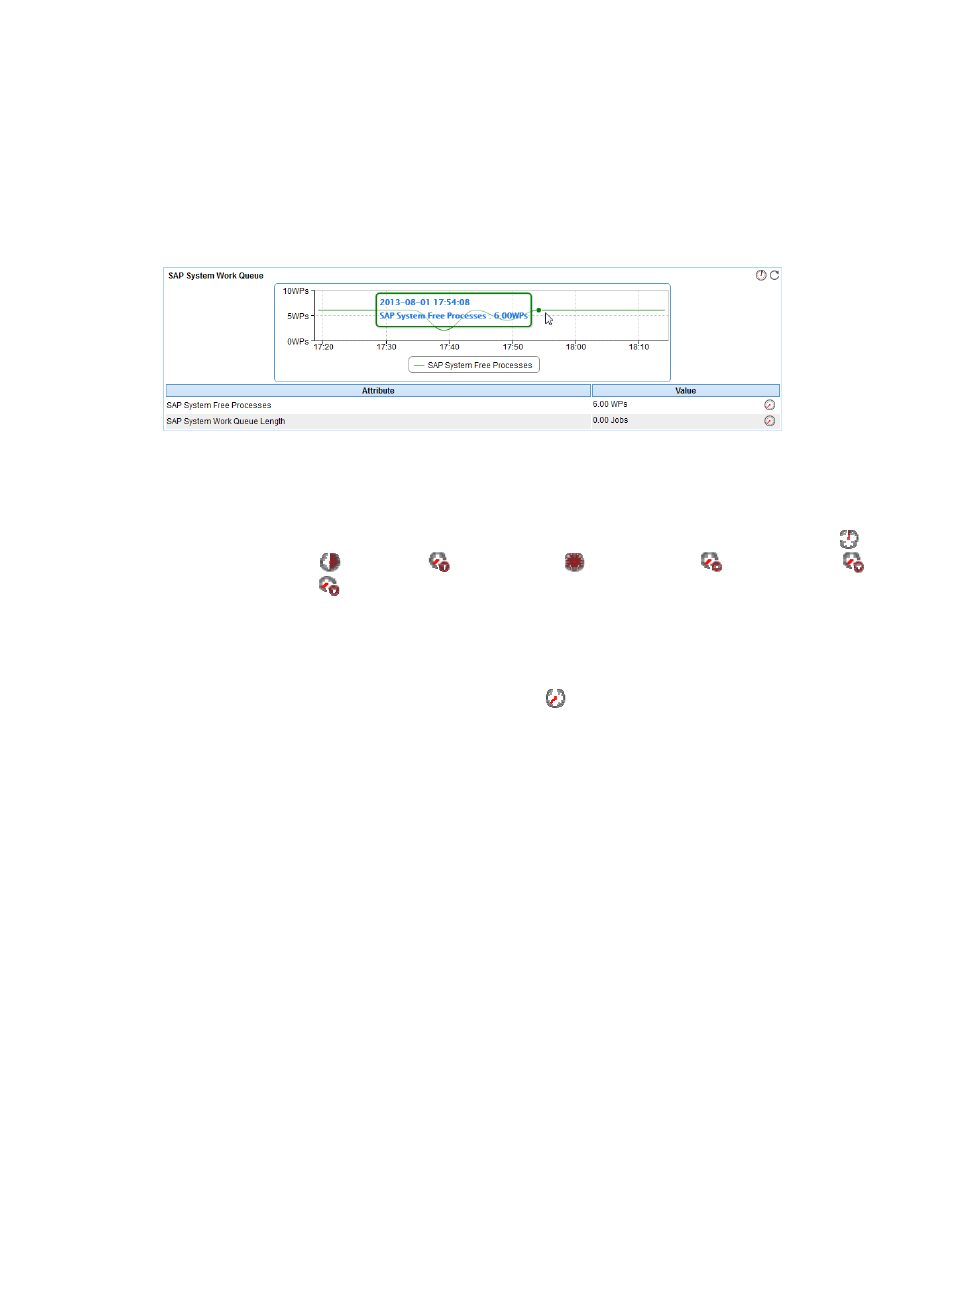
SAP System Work Queue
The SAP System Work Queue area is located on the Background tab and its layout is shown in
.
Figure 530 SAP System Work Queue area layout
SAP System Work Queue area fields:
•
Trend graph—Shows the changes in the number of idle SAP processes in a line chart. Point to a spot
on the curve to view the number of idle SAP processes at the specific time point. View the changes
in the number of idle SAP processes over a specific time period by clicking the Last 1 Hour icon
,
Last 6 Hours icon
, Today icon
, Yesterday icon
, This Week icon
, This Month icon
,
or This Year icon
. The graph shows the last hour data by default.
•
Attribute/Value—Monitor index name and data that was obtained when APM last polled SAP.
{
SAP System Free Processes—Number of idle SAP processes.
{
SAP System Work Queue Length—Length of the SAP system work queue.
{
History Record—Click the History Record icon
to view the history trend graph of the idle
SAP processes or SAP system work queue. Point to a spot on the curve to view data at the
specific time point. Authorized users can view idle SAP process and work queue length statistics
over the last 1 hour, last 6 hours, today, yesterday, this week, this month, and this year by
clicking the corresponding icons on the graph.
Dialog Network Response Time
The Dialog Network Response Time area is located on the Dialog tab and its layout is shown in