Storage volume information – H3C Technologies H3C Intelligent Management Center User Manual
Page 724
710
•
ID—ID of the disk.
•
Health Status—Health status of the disk in the last polling period. Click the Set Threshold icon
to set alarm thresholds for the health status of the disk. Use the global thresholds or custom
thresholds. For information about setting the thresholds, see "
•
Disk Capacity—Capacity of the disk.
•
Free Space—Free space of the disk in the last polling period.
•
Used Space—Used space of the disk in the last polling period.
•
Disk Usage—Usage of the disk in the last polling period. Click the History Record icon
to view
the disk usage statistics in a line graph. Authorized users can view statistics over the last 1 hour, last
6 hours, today, yesterday, this week, this month, and this year by clicking the corresponding icons.
•
More—Click More... to view disk information of all disks. By default, the report displays disk
information of only the first 10 disks when the HP MSA P2000 has more than 10 disks.
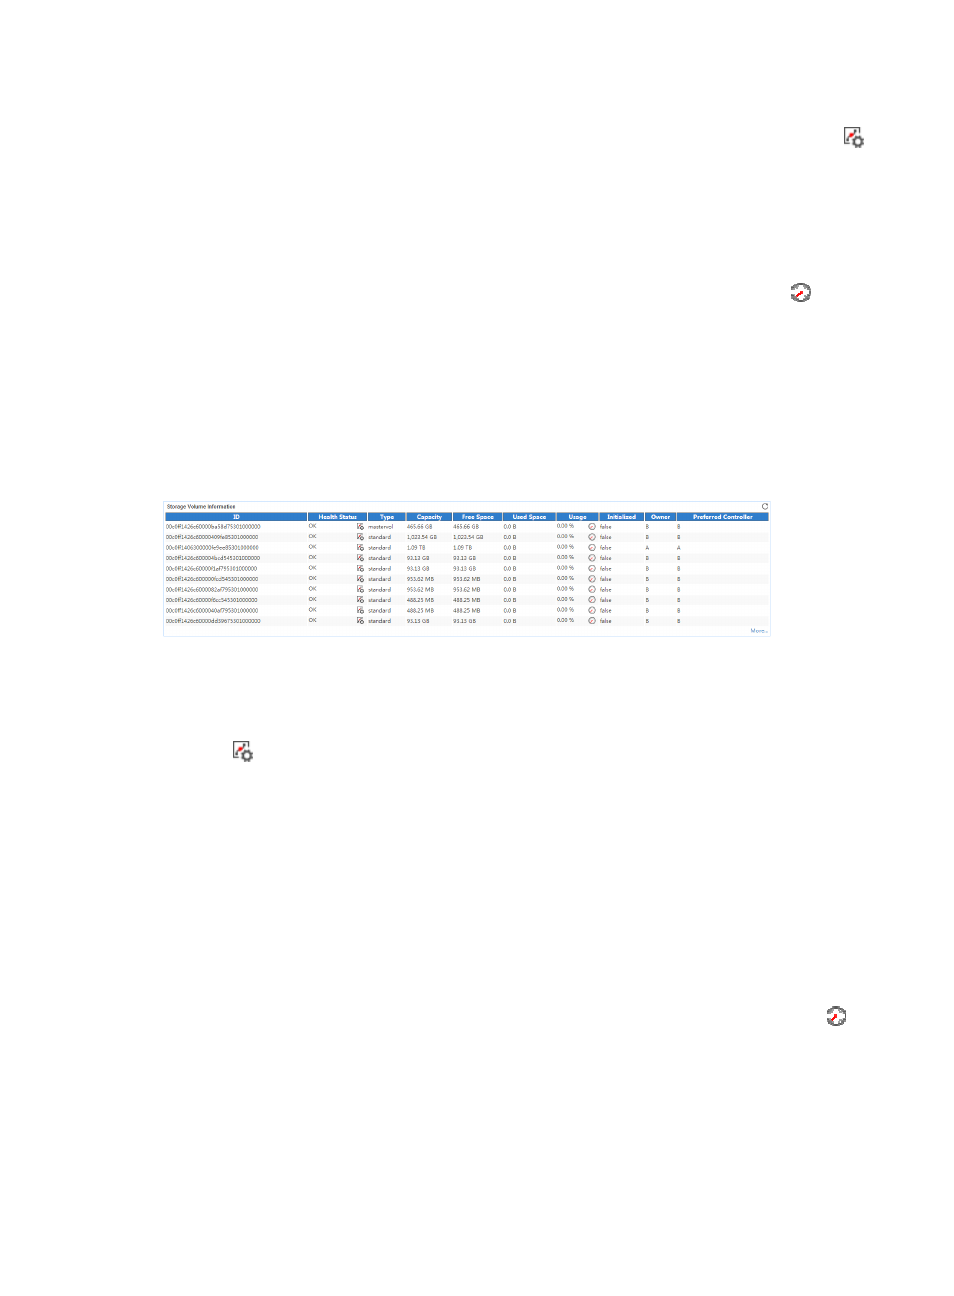
Storage Volume Information
The Storage Volume Information area layout is shown in
Figure 632 Storage Volume Information area layout
Storage Volume Information area fields:
•
ID—ID of the storage volume.
•
Health Status—Health status of the storage volume in the last polling period. Click the Set Threshold
icon
to set alarm thresholds for the health status of the storage volume. Use the global thresholds
or custom thresholds. For information about setting the thresholds, see "
•
Type—Type of the storage volume:
{
Standard—Standard volume.
{
Mastervol—Master volume.
{
Snap-pool—Snap-pool volume.
•
Capacity—Capacity of the disk.
•
Free Space—Free space of the storage volume in the last polling period.
•
Used Space—Used space of the storage volume in the last polling period.
•
Usage—Usage of the storage volume in the last polling period. Click the History Record icon
to
view the volume usage statistics in a line graph. Authorized users can view statistics over the last 1
hour, last 6 hours, today, yesterday, this week, this month, and this year by clicking the
corresponding icons.
•
Initialized—Whether the storage volume was being initialized in the last polling period.
•
Owner—Storage controller that managed the storage volume in the last polling period.
•
Preferred Controller—Optimal controller for managing the storage volume.