File information, N in, Figure 334 – H3C Technologies H3C Intelligent Management Center User Manual
Page 416
402
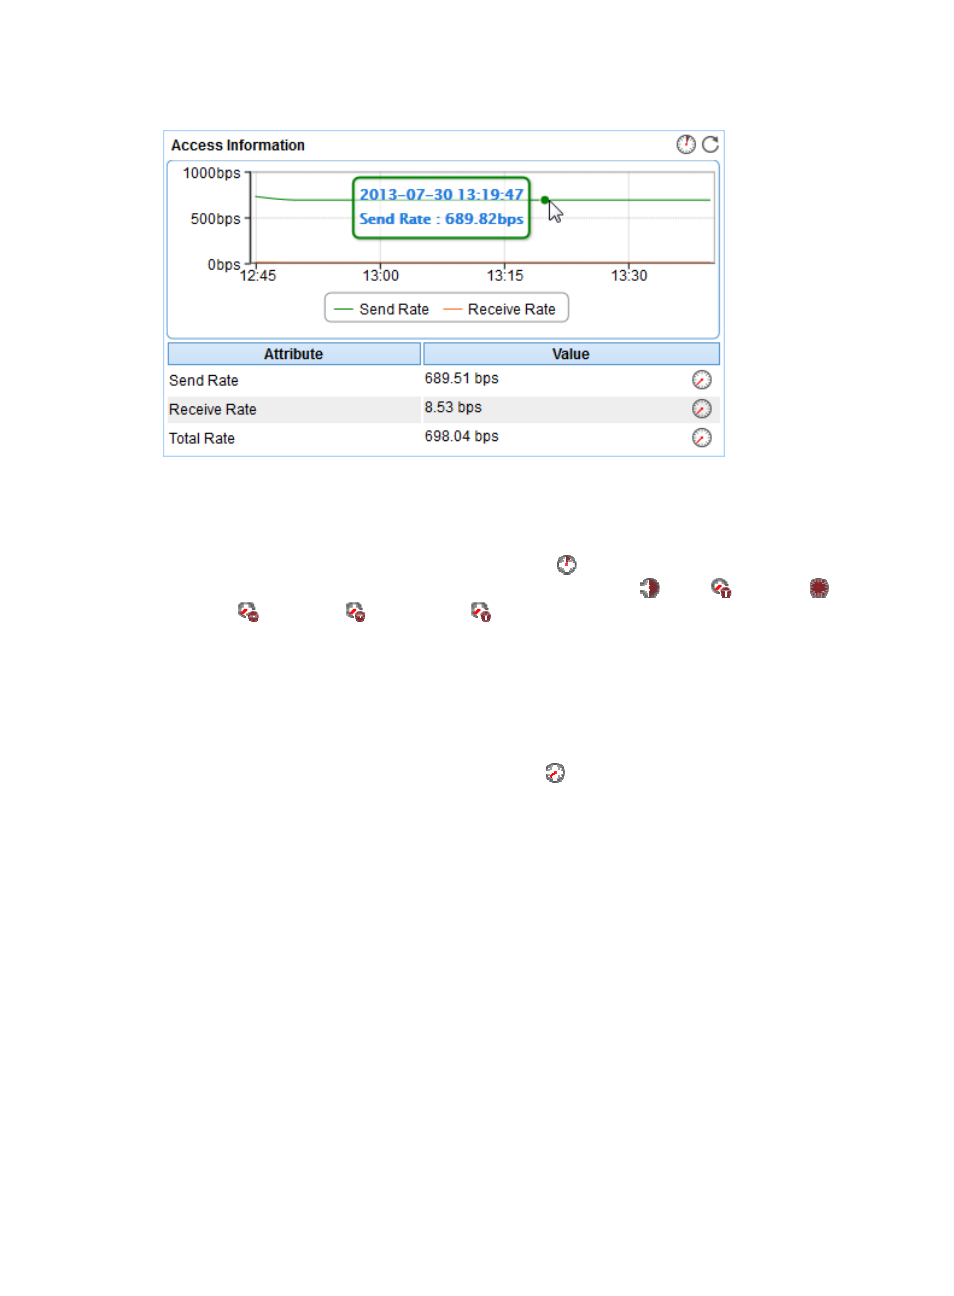
Figure 334 Access Information area layout
Access Information area fields:
•
Access Information trend graph—Shows changes of the send/receive rates over the last 1 hour in
a graph. Point to a spot on the curve to view the send/receive rates at the specific time point. To
change the report period, click the Last 1 Hour icon
on the upper right of the graph, and then
select an icon from the list. Available options include Last 6 Hours
, Today
, Yesterday
, This
Week
, This Month
, and This Year
.
•
Attribute/Value—Monitor index name and data.
{
Send Rate—Data sending rate of the IIS server when APM last polled the IIS server.
{
Receive Rate—Data receiving rate of the IIS server when APM last polled the IIS server.
{
Total Rate—Data transmitting rate of the IIS server when APM last polled the IIS server. The total
rate is approximately the sum of the send rate and the receive rate.
{
History Record—Click the History Record icon
to view the trend statistics of the history
send/receive rates in a line graph. Operators can view send/receive rates statistics over the last
1 hour, last 6 hours, today, yesterday, this week, this month, and this year by clicking the
corresponding icons on the upper right of the graph.
File Information
The File Information area layout is shown in