Availability today – H3C Technologies H3C Intelligent Management Center User Manual
Page 261
247
•
Last Polling Time—Time when APM last polled MySQL.
•
Relationship icon
—Click the Relationship icon
to view dependencies between MySQL and
other applications in the dependency topology. For more information about dependency
topologies, see "
4 Topology and application group management
•
Top5 Unrecovered Alarm—Latest five unrecovered alarms on the MySQL host. The alarm level is
identified by color: yellow for minor alarms, orange for major alarms, and red for critical alarms.
This field does not appear if no alarm is generated by the MySQL application.
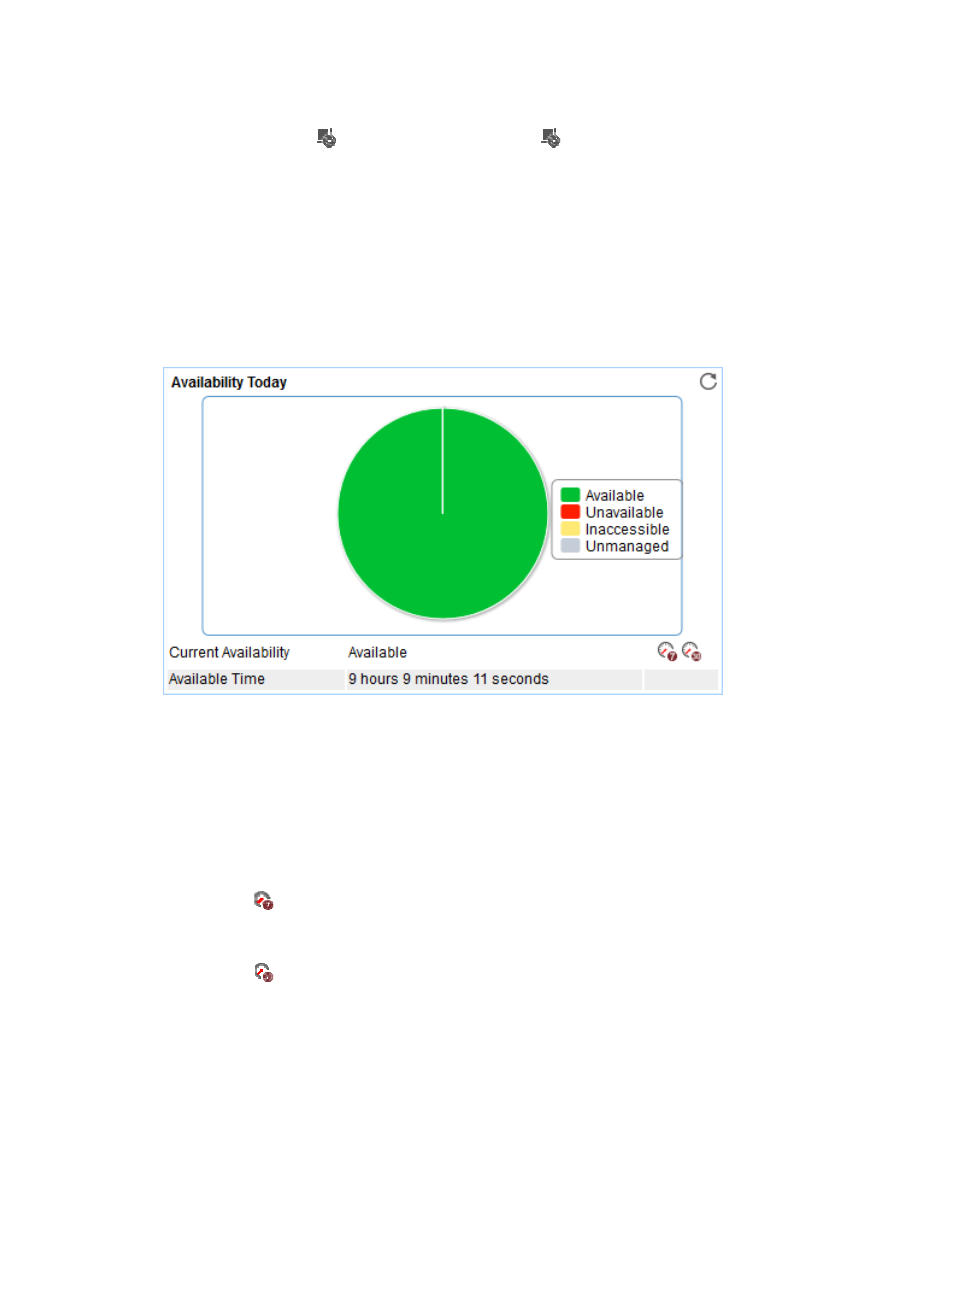
Availability Today
The Availability Today area layout is shown in
Figure 197 Availability Today area layout
Availability Today area fields:
•
Availability pie chart—Shows time duration percentages of the availability states
for the MySQL
application today. The availability states include Available, Unavailable, Inaccessible, and
Unmanaged. To view the time duration percentage of a specific availability state, point to the
corresponding slice in the chart.
•
Current Availability—Availability of the MySQL application in the last polling period.
{
To view the availability of the MySQL application in the last 7 days, click the Weekly History
icon
. The weekly availability data is collected hourly. To view the time duration percentages
of availability states at a specific time, point to that time.
{
To view the availability of the MySQL application in the last 30 days, click the Monthly History
icon
. The monthly availability data is collected daily. To view the time duration percentages
of availability states on a specific day, point to that day.
•
Available Time—Total available time duration of the MySQL application since 00:00 today.
•
Unavailable Time—Total unavailable time duration of the MySQL application since 00:00 today.
•
Inaccessible Time—Total inaccessible time duration of the MySQL application since 00:00 today.
•
Unmanaged Time—Total unmanaged time duration of the MySQL application since 00:00 today.
Availability time statistics of a new application monitor are collected since the application monitor was
added. An availability time field does not appear when its value is 0.