I/o state, Session information – H3C Technologies H3C Intelligent Management Center User Manual
Page 168
154
{
Set Threshold—Click the Threshold setting icon
to set alarm thresholds of the CPU usage
ratio for the monitored process. The data is highlighted in orange when the CPU usage ratio
reaches the level-1 threshold, and is highlighted in red when the CPU usage ratio reaches the
level-2 threshold. Use the global thresholds or custom thresholds. For information about setting
the thresholds, see "
{
History Record—Click the History Record icon
to view the history graph of the CPU usage
ratio of the monitored process. Point to a spot on the curve to view the data at the specific time
point. Authorized users can view CPU usage statistics over the last 1 hour, last 6 hours, today,
yesterday, this week, this month, and this year by clicking the corresponding icons.
•
Memory Usage—Memory usage ratio of the monitored process in the last APM polling period.
{
History Record—Click the History Record icon
to view the history graph of the memory
usage ratio of the monitored process. Point to a spot on the curve to view the data at the specific
time point. Authorized users can view memory usage statistics over the last 1 hour, last 6 hours,
today, yesterday, this week, this month, and this year by clicking the corresponding icons.
•
CPU Time—Duration that the process occupies the CPU in the most recent polling interval.
•
More—The Process area displays information about up to 10 processes. Click More to view
information about all processes.
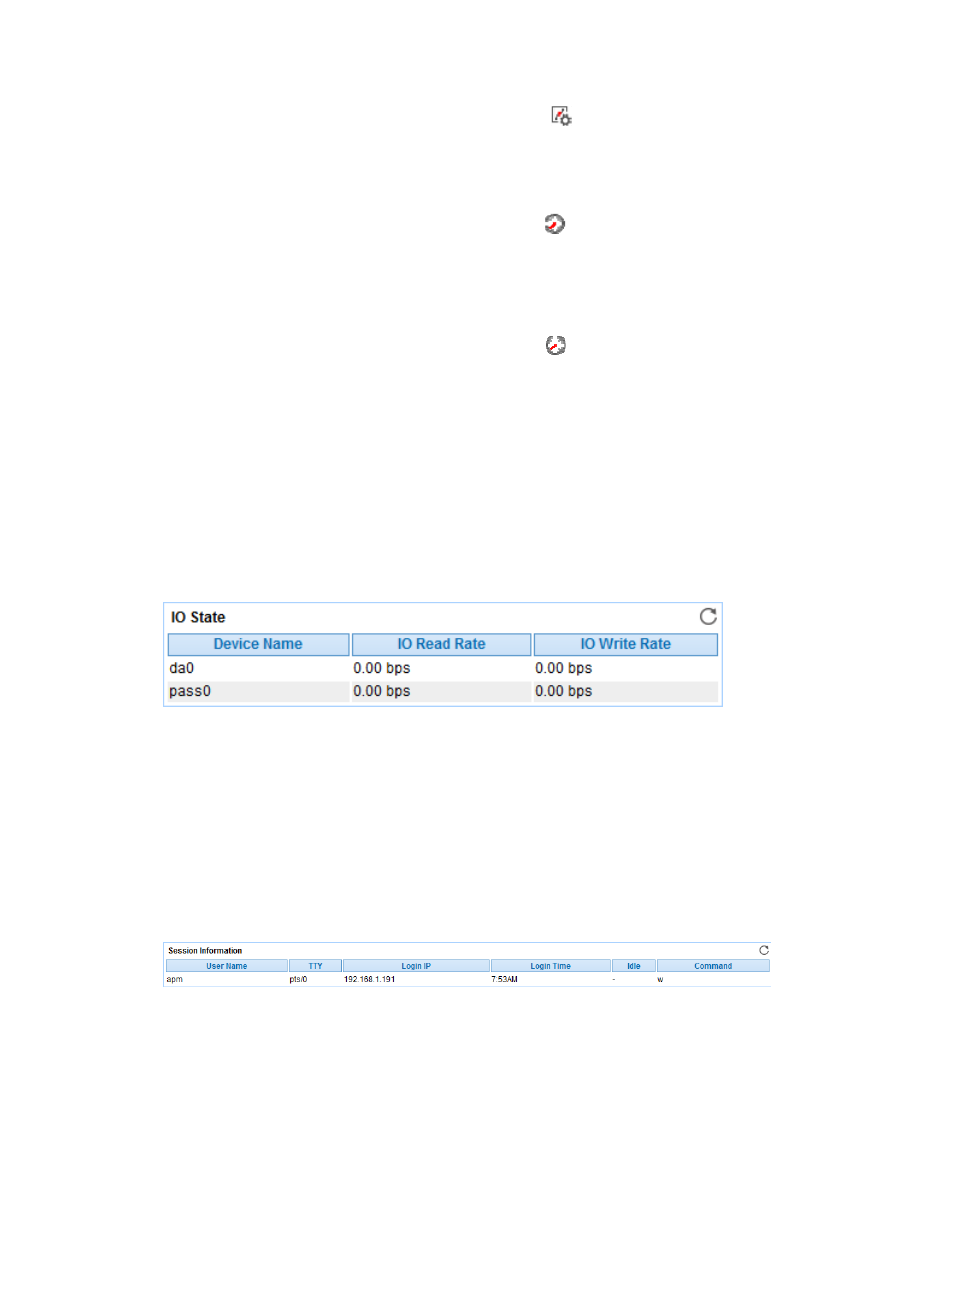
I/O State
APM can monitor the I/O status of the disk drivers in the FreeBSD system, as shown in
.
Figure 104 I/O State area layout
I/O State area fields:
•
Device Name—Name of the disk drivers in the FreeBSD system.
•
I/O Read Rate—Size of the input/output data in the disk driver per second.
•
I/O Write Rate—Size of the input data in the disk driver per second.
Session Information
The Session Information area displays FreeBSD session login information.
Figure 105 Session Information area layout
Session Information area fields:
•
User Name—User logging in to FreeBSD in the most recent polling interval.
•
TTY—TTY used by the user.
•
Login Time—Time when the user logs in to FreeBSD.
•
Idle—Idle time after the user logs in to FreeBSD.
•
Command—Most recently executed command after the user logs in to FreeBSD.