Application traffic, Network interface – H3C Technologies H3C Intelligent Management Center User Manual
Page 183
169
{
History Record—Click the History Record icon
to view the history graph of the CPU usage
of the zombie process in last 1 hour, last 6 hours, today, yesterday, this week, this month, or this
year.
•
Memory Usage—Memory usage of the zombie process in the most recent polling interval.
{
History Record—Click the History Record icon
to view the history graph of the memory
usage of the zombie process in last 1 hour, last 6 hours, today, yesterday, this week, this month,
or this year.
•
CPU Time—Duration that the zombie process occupies the CPU in the most recent polling interval.
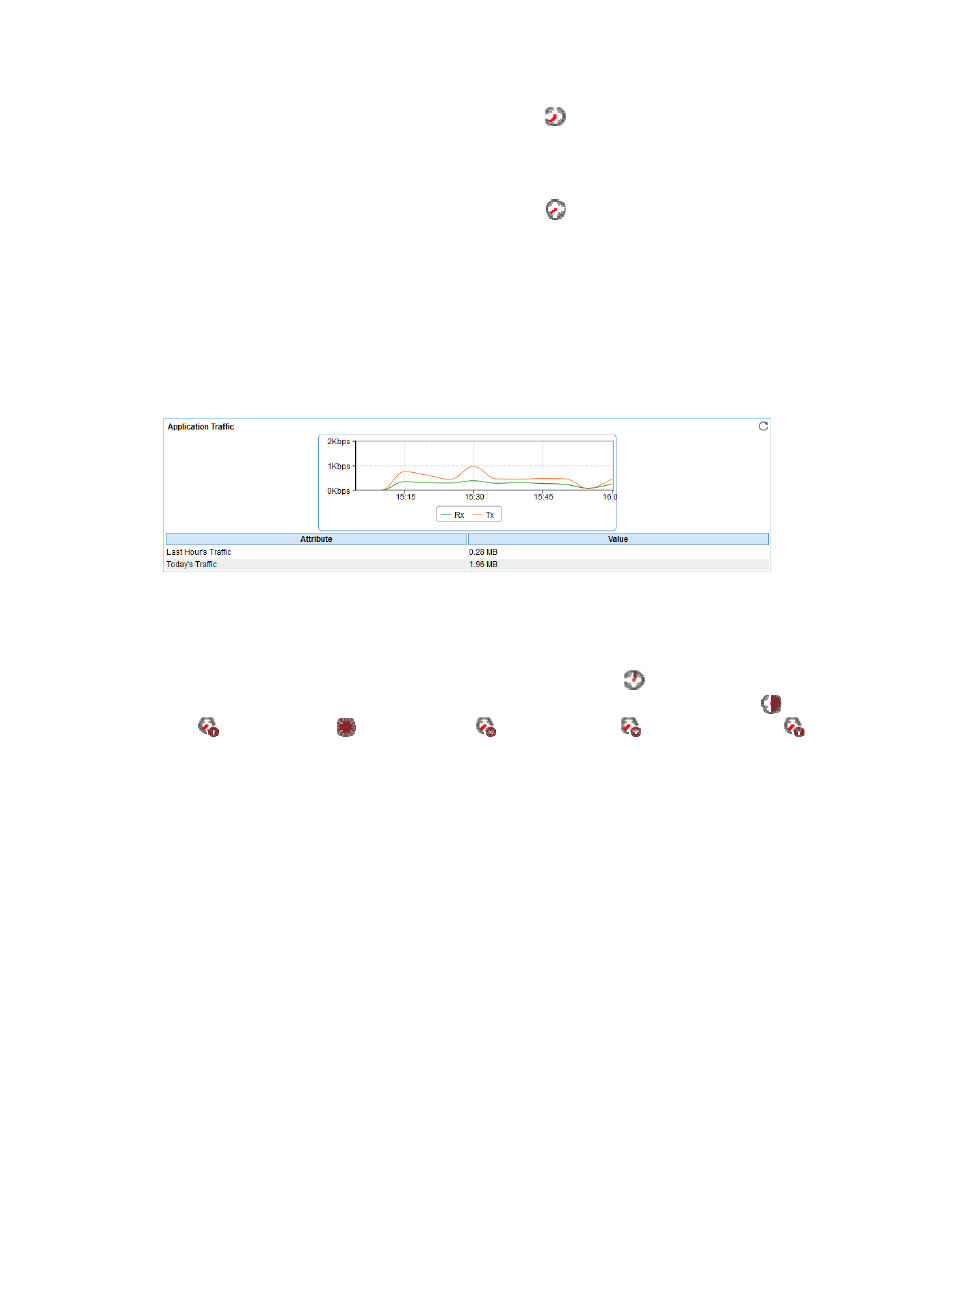
Application Traffic
APM collects Mac OS traffic based on the IP address of the host where the application resides. The
Application Traffic area layout is shown in
.
Figure 118 Application Traffic area layout
Application Traffic area fields:
•
Application Traffic trend graph—Shows changes of inbound and outbound Mac OS traffic over the
last 1 hour. The green curve shows the inbound traffic and the orange curve shows the outbound
traffic. To change the report period, click the Last 1 Hour icon
on the upper right of the graph,
and then select an icon from the list. Available options include the Last 6 Hours icon
, Today icon
, Yesterday icon
, This Week icon
, This Month icon
, and This Year icon
. Point to
a spot on the curve to view the application traffic at the specific time point. Click Rx or Tx to display
or hide the corresponding monitor index in the graph.
•
Attribute/Value—Monitor index name and data that was obtained when APM last polled Mac OS.
{
Last Hour's Traffic—Total traffic sent and received by Mac OS over the last 1 hour.
{
Today's Traffic—Total traffic sent and received by Mac OS since 00:00 today.
Network Interface
The Network Interface area layout is shown in
.