Figure 260 – H3C Technologies H3C Intelligent Management Center User Manual
Page 327
313
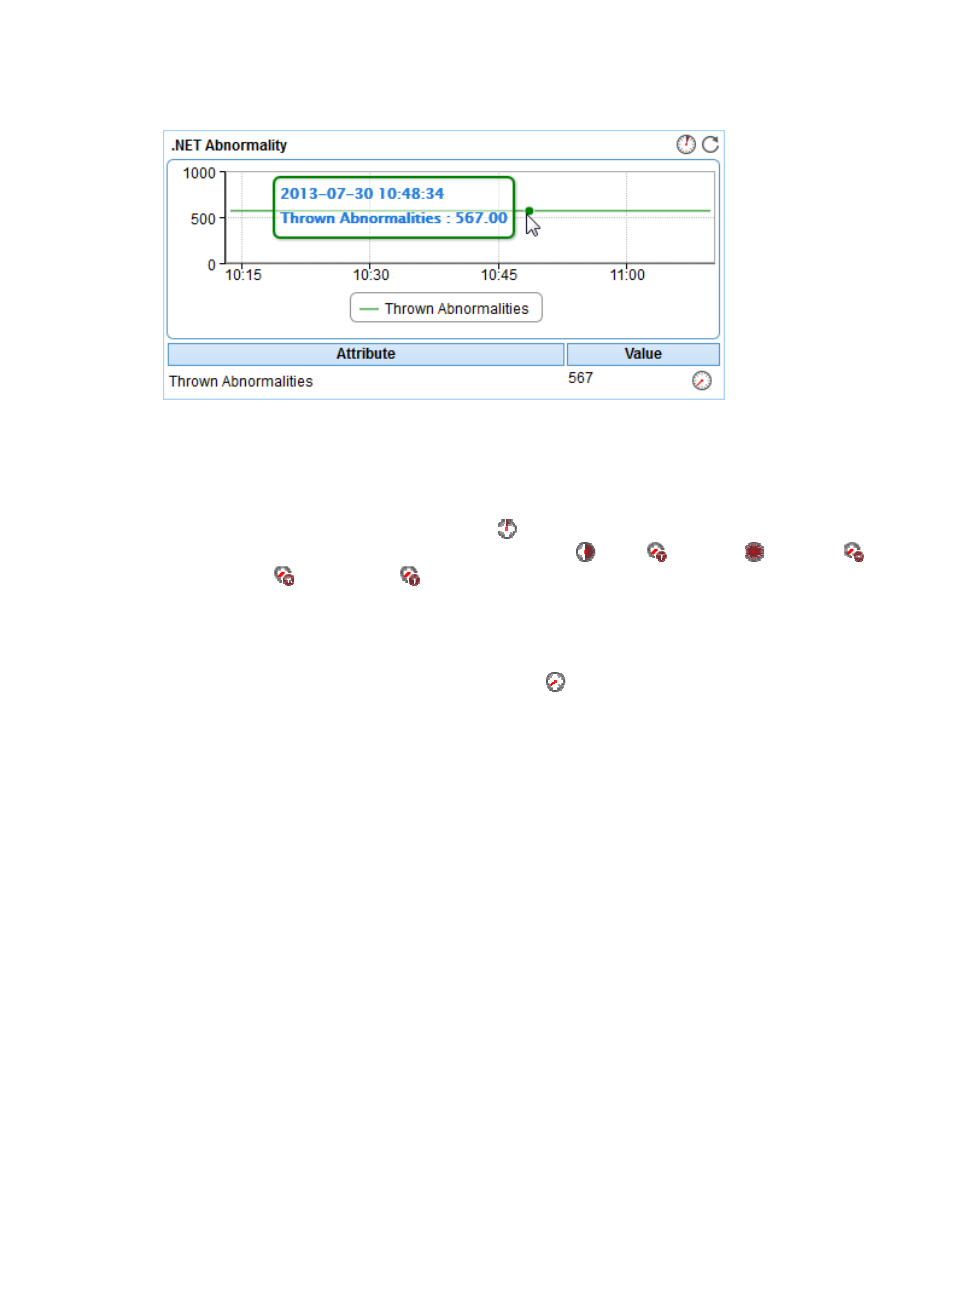
Figure 260 .NET Abnormality area layout
.NET Abnormality area fields:
•
Thrown abnormalities trend graph—Shows changes of the number of thrown abnormalities over
the selected time period in a line graph. Point to a spot on the curve to view the number of thrown
abnormalities at the specific time point. By default, the graph shows the last 1 hour data. To change
the report period, click the Last 1 Hour icon
on the upper right of the graph, and then select an
icon from the list. Available options include Last 6 Hours
, Today
, Yesterday
, This Week
,
This Month
, and This Year
.
•
Attribute/Value—Monitor index name and data obtained when APM last polled the .NET server.
{
Thrown Abnormalities—Total number of abnormalities thrown by the .NET server since
the .NET server started.
{
History Record—Click the History Record icon
to view trend statistics of the number of
thrown abnormalities of the .NET server in a line graph. Point to a spot on the curve to view the
data at the specific time point. Authorized users can view statistics over the last 1 hour, last 6
hours, today, yesterday, this week, this month, and this year by clicking the corresponding
icons.
JIT
The JIT area layout is shown in
Just-in-time (JIT) is the .NET framework compiler which converts the Microsoft Intermediate Language
(MSIL) to native code on an as needed basis. CPU usage is a major indicator of JIT. JIT area layout.