Monitor information – H3C Technologies H3C Intelligent Management Center User Manual
Page 507
493
1.
Click the Resource tab.
2.
Select Application Manager > Application Monitor from the navigation tree.
The application monitor list page displays all application monitors.
3.
Click the name link of a file monitor.
The monitor report of the file appears, as shown in
. For information about the icons in
the monitor report, see "
." This section describes the fields in each area of the monitor
report.
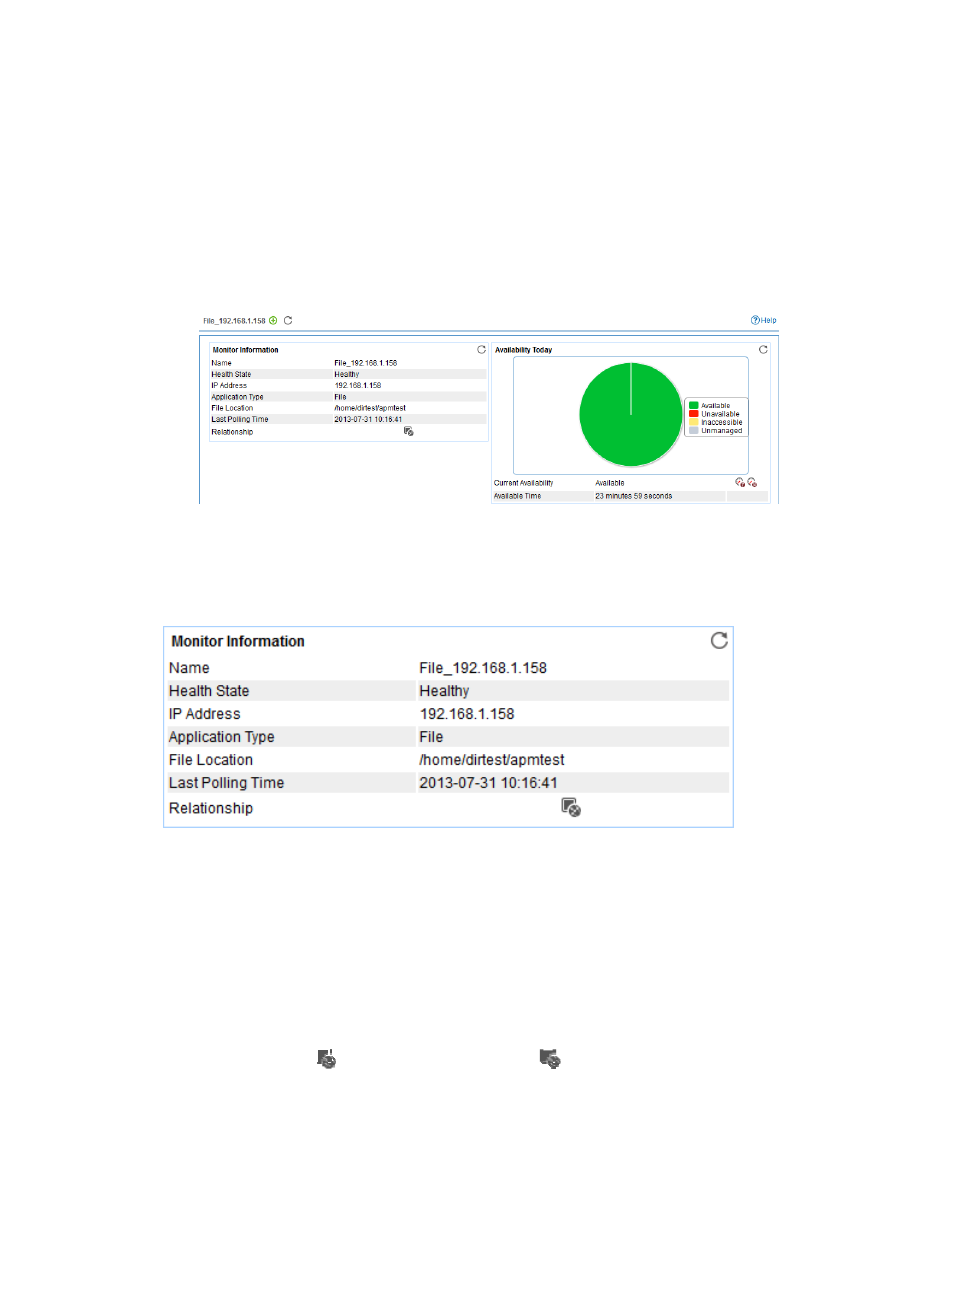
Figure 407 Part of a file monitor report
Monitor Information
The Monitor Information area layout is shown in
.
Figure 408 Monitor Information area layout
Monitor Information area fields:
•
Name—Application monitor name.
•
Health State—Health status of the file.
•
IP Address—IP address of the host where the file is located.
•
Application Type—Type of the monitored application, which is always File.
•
File Location—Absolute path of the monitored file.
•
Last Polling Time—Time when APM last polled the file.
•
Relationship icon
—Click the Relationship icon
to view relations between applications in a
dependency topology view. For more information about dependency topologies, see "
and application group management
•
Top5 Unrecovered Alarm—Latest five unrecovered alarms on the file. The alarm level is identified by
color: yellow for minor alarms, orange for major alarms, and red for critical alarms. This field does
not appear if no alarm is generated by the file.