Web application details, Servlet details, Figure 296 – H3C Technologies H3C Intelligent Management Center User Manual
Page 373
359
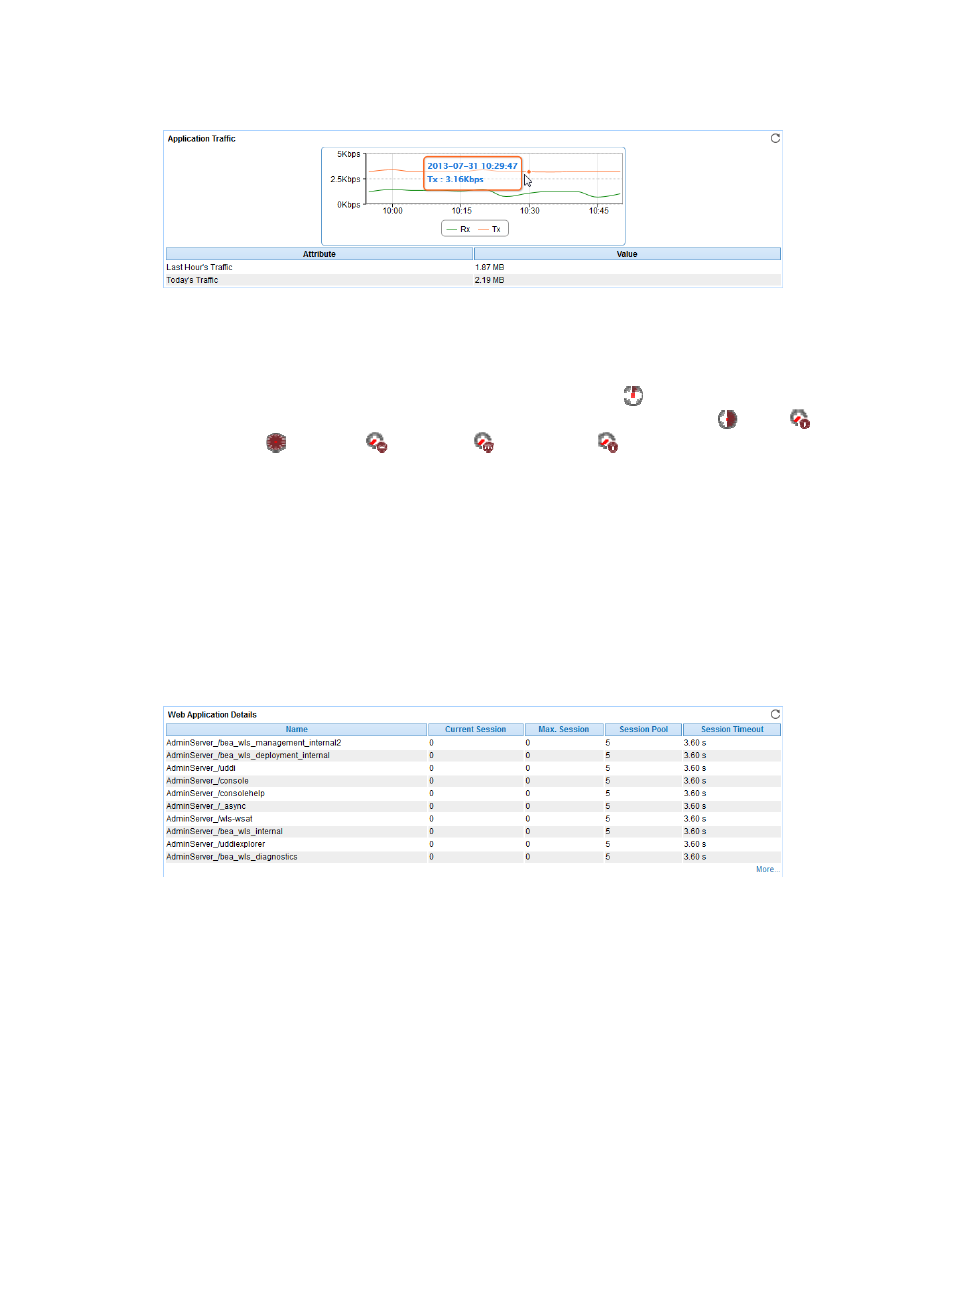
Figure 296 Application Traffic area layout
Application Traffic area fields:
•
Application Traffic trend graph—Shows changes of inbound (Rx) and outbound (Tx) traffic over the
last 1 hour. The green curve shows the inbound traffic and the orange curve shows the outbound
traffic. To change the report period, click the Last 1 Hour icon
on the upper right of the graph,
and then select an icon from the list. Available options include Last 6 Hours
, Today
,
Yesterday
, This Week
, This Month
, and This Year
. Point to a spot on the curve to view
the application traffic at the specific time point. Click Rx or Tx to display or hide the corresponding
monitor index in the graph.
•
Attribute/Value—Monitor index name and data that was obtained when APM last polled the
WebLogic server.
{
Last Hour's Traffic—Total traffic sent and received by the WebLogic server over the last 1 hour.
{
Today's Traffic—Total traffic sent and received by the WebLogic server since 00:00 today.
Web Application Details
The Web Application Details area is as shown in
Figure 297 Web Application Details area layout
Web Application Details area fields:
•
Name—Name of the Web application.
•
Current Session—Number of sessions that were accessing the Web application in the last polling
interval.
•
Max. Session—Maximum number of sessions that can access the Web application in the last
polling interval.
•
Session Pool—Maximum number of sessions allowed in the session pool in the last polling interval.
•
Session Timeout—Maximum time a session can remain idle before being terminated.
Servlet Details
The Servlet Details area displays information about 10 servlets, as shown in
.