Request number, Application traffic – H3C Technologies H3C Intelligent Management Center User Manual
Page 408
394
{
To view the availability of the Apache server in the last 30 days, click the Monthly History icon
. The monthly availability data is collected daily. To view the time duration percentages of
availability states on a specific day, place the cursor over that day.
•
Available Time—Total available time duration of the Apache server since 00:00 today.
•
Unavailable Time—Total unavailable time duration of the Apache server since 00:00 today.
•
Inaccessible Time—Total inaccessible time duration of the Apache server since 00:00 today.
•
Unmanaged Time—Total unmanaged time duration of the Apache server since 00:00 today.
The availability time statistics of a new application monitor are collected since the application monitor
was added. An availability time field does not appear if its value is 0.
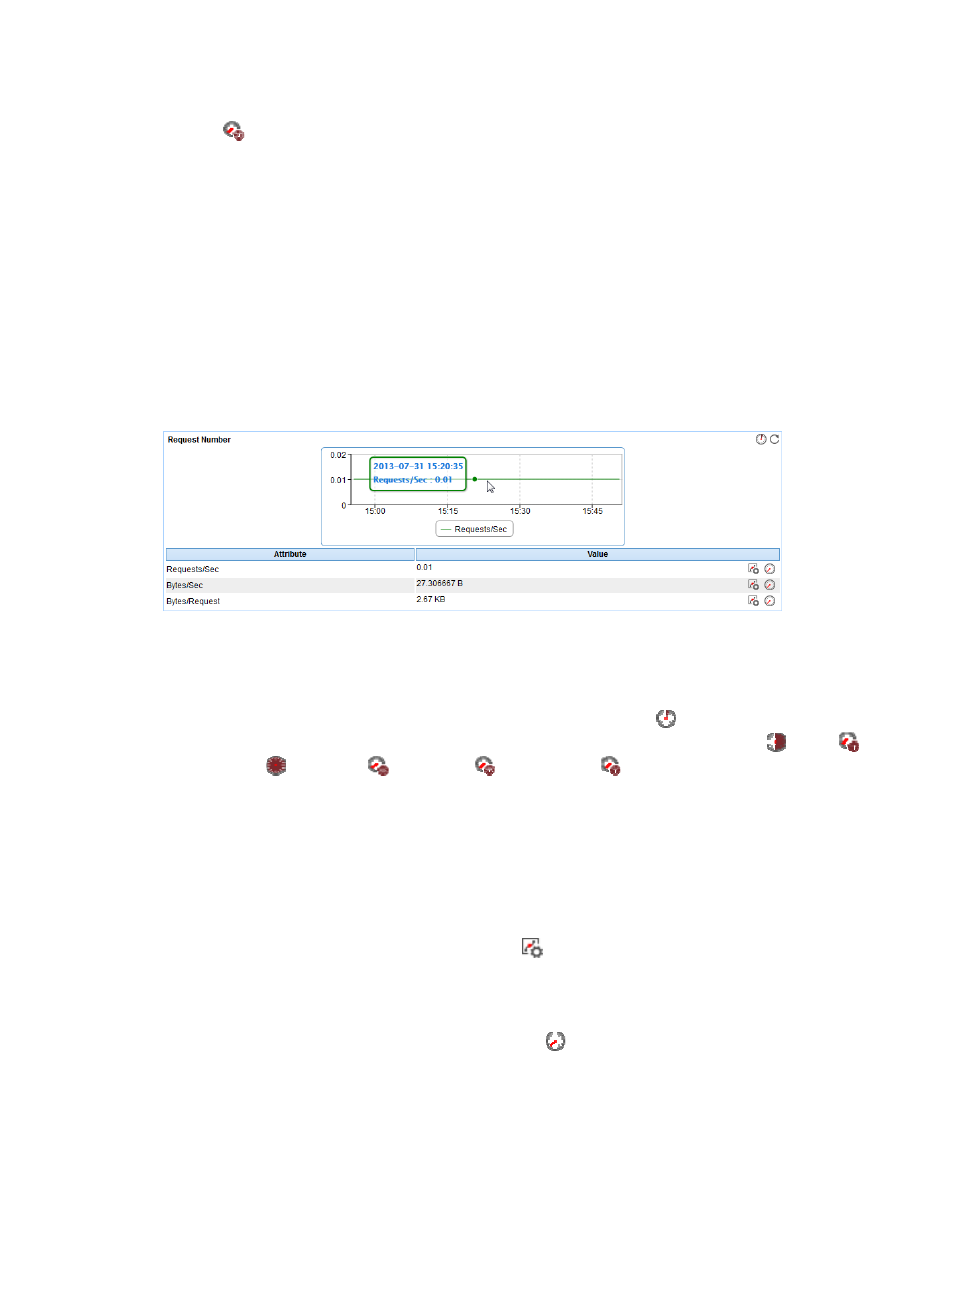
Request Number
The Request Number area layout is shown in
Figure 327 Request Number area layout
Request Number area fields:
•
Request Number trend graph—View the changes of the per-second request number for the Apache
server in a graph. Point to a spot on the curve to view the per-second request number at the specific
time point. To change the report period, click the Last 1 Hour icon
on the upper right of the
graph, and then select an icon from the list. Available options include Last 6 Hours
, Today
,
Yesterday
, This Week
, This Month
, and This Year
.
•
Attribute/Value—Monitor index name and data.
{
Requests/Sec—Average number of requests received by the Apache server per second from the
startup time of the Apache server to the time when APM last polled the Apache server.
{
Bytes/Sec—Average number of bytes received by the Apache server per second from the
startup time of the Apache server to the time when APM last polled the Apache server.
{
Bytes/Request—Average size of requests received by the Apache server.
{
Set Threshold—Click the Set Threshold icon
for a monitor index to set the alarm thresholds
for the monitor index. When the level-1 alarm threshold is reached, the index value is
highlighted in orange. When the level-2 alarm threshold is reached, the index value is
highlighted in red. Use the global thresholds or custom thresholds.
{
History Record—Click the History Record icon
to view the statistics of the history monitor
index trend for the Apache server. Authorized users can view CPU usage ratio statistics over the
last 1 hour, last 6 hours, today, yesterday, this week, this month, and this year by clicking the
corresponding icons on the upper right of the graph.
Application Traffic
The Application Traffic area layout is shown in
.