Directory incremental – H3C Technologies H3C Intelligent Management Center User Manual
Page 517
503
highlighted in red when it reaches the level-2 threshold. Use either global thresholds or custom
thresholds. For information about setting the thresholds, see "
{
History Record—Click the History Record icon
to view history graph of the directory size
change trend. Point to a spot on the curve to view the directory size at the specific time point.
Authorized users can view directory size statistics over the last 1 hour, last 6 hours, today,
yesterday, this week, this month, and this year by clicking the corresponding icons on the upper
right of the graph.
Directory Incremental
The Directory Incremental area layout is shown in
.
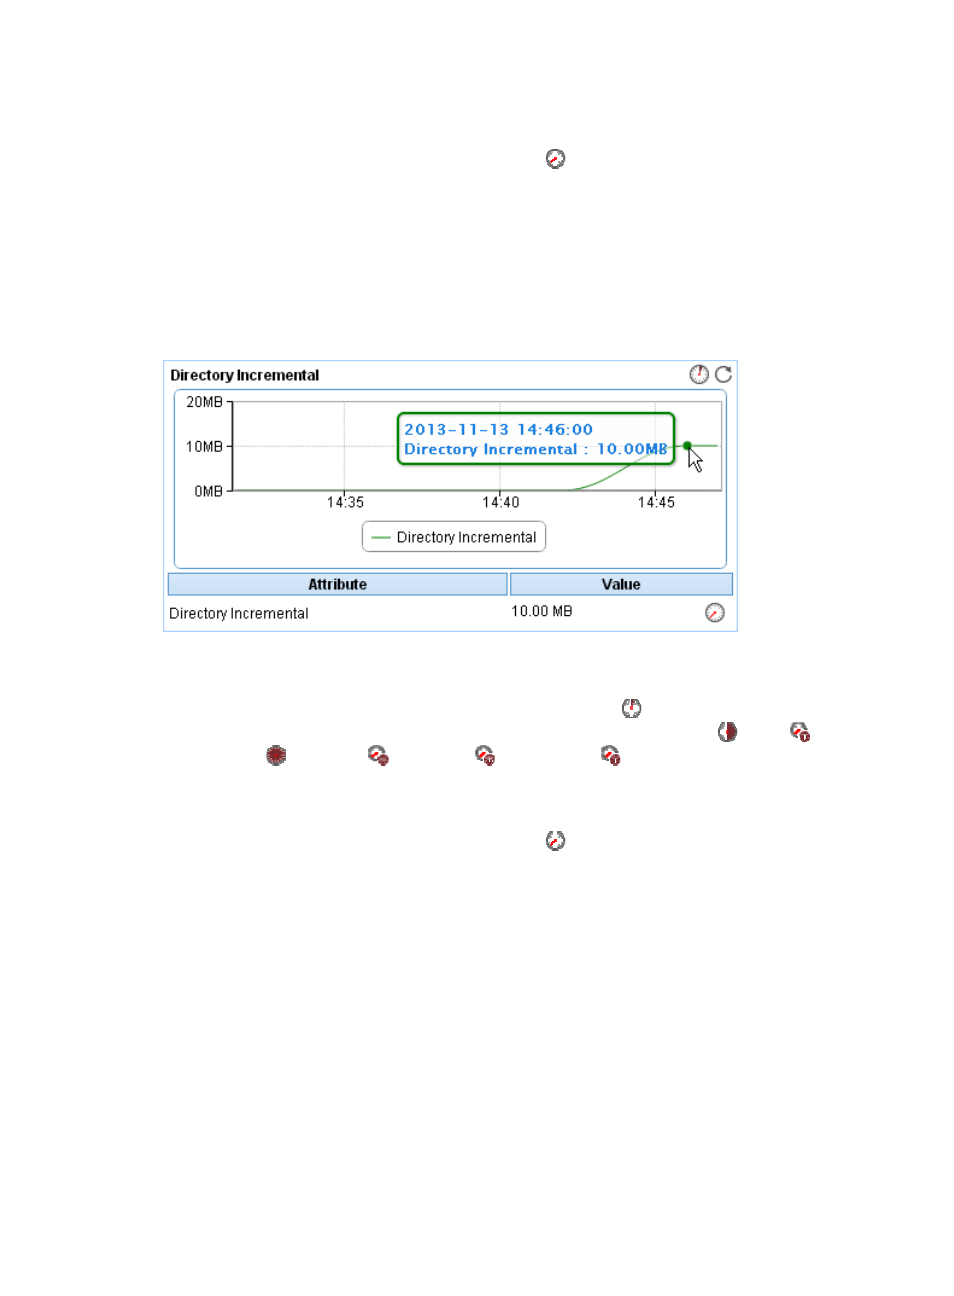
Figure 415 Directory Incremental area
•
Directory Incremental trend graph—Shows the directory incremental over the last 1 hour in a line
chart. Place the cursor over a spot in the curve to view the directory incremental at the specific time
point. To change the report period, click the Last 1 Hour icon
on the upper right of the graph,
and then select an icon from the list. Available options include Last 6 Hours
, Today
,
Yesterday
, This Week
, This Month
, and This Year
.
•
Attribute/Value—Monitor index name and data.
{
Directory Incremental—Size change of the directory in the last polling period.
{
History Record—Click the History Record icon
to view history graph of the directory
incremental trend. Point to a spot on the curve to view the directory incremental at the specific
time point. Authorized users can view directory incremental statistics over the last 1 hour, last 6
hours, today, yesterday, this week, this month, and this year by clicking the corresponding icons
on the upper right of the graph.