Jetty, Adding a jetty application monitor – H3C Technologies H3C Intelligent Management Center User Manual
Page 395
381
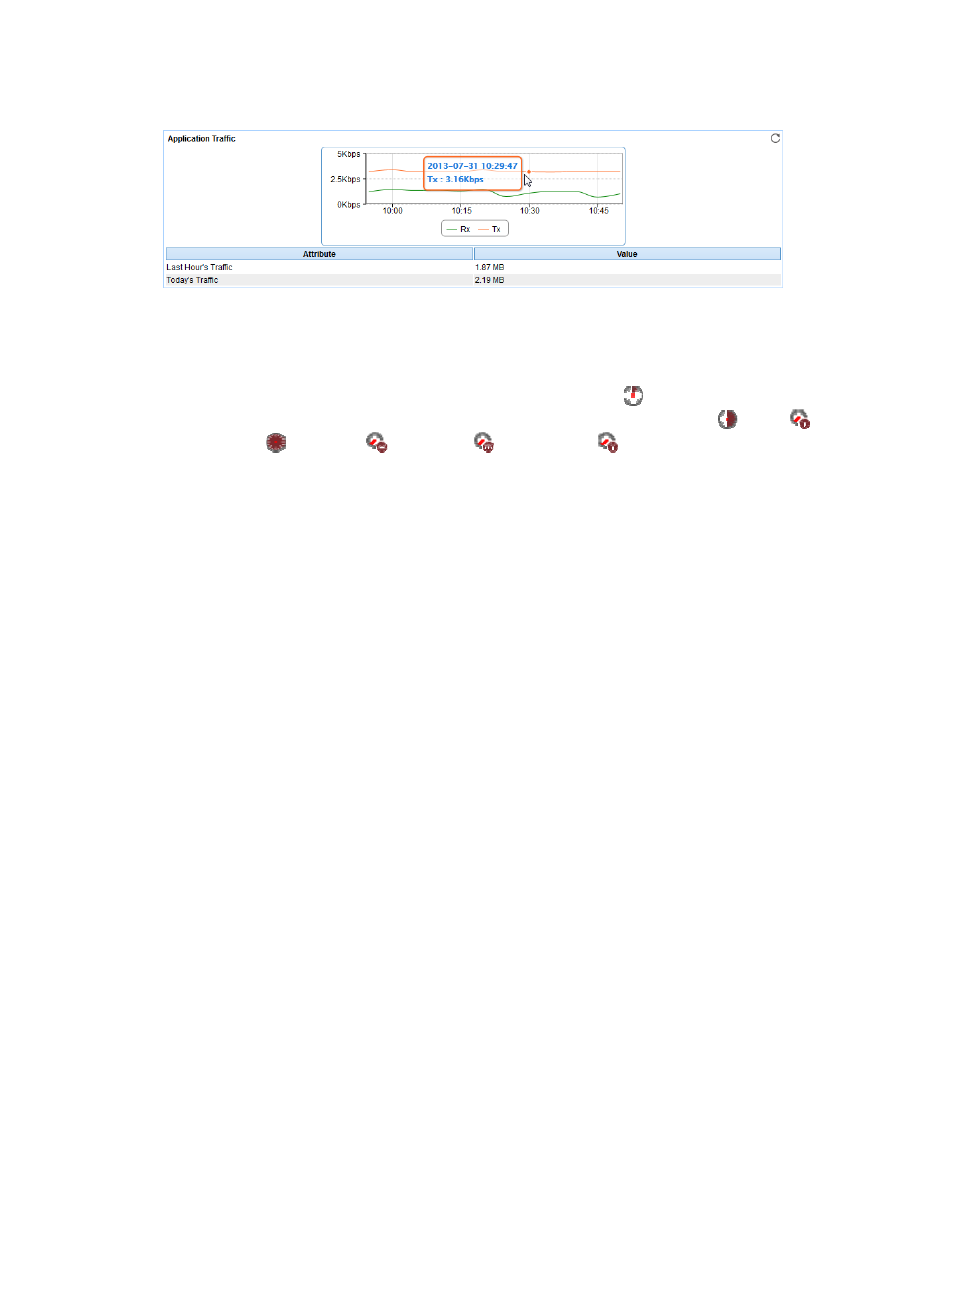
Figure 321 Application Traffic area layout
Application Traffic area fields:
•
Application Traffic trend graph—Shows changes of inbound (Rx) and outbound (Tx) traffic over the
last 1 hour. The green curve shows the inbound traffic and the orange curve shows the outbound
traffic. To change the report period, click the Last 1 Hour icon
on the upper right of the graph,
and then select an icon from the list. Available options include Last 6 Hours
, Today
,
Yesterday
, This Week
, This Month
, and This Year
. Point to a spot on the curve to view
the application traffic at the specific time point. Click Rx or Tx to display or hide the corresponding
monitor index in the graph.
•
Attribute/Value—Monitor index name and data that was obtained when APM last polled the
WebSphere server.
{
Last Hour's Traffic—Total traffic sent and received by the WebSphere server over the last 1 hour.
{
Today's Traffic—Total traffic sent and received by the WebSphere server since 00:00 today.
Jetty
Jetty is an open source servlet container and serves Java-based Web content. APM can monitor Jetty
9.0.5 through JMX.
The following information describes how to add and modify a Jetty application monitor, and view the
monitor report.
Adding a Jetty application monitor
Before you add a Jetty application monitor, perform the following tasks:
•
Contact the Jetty administrator to enable JMX.
•
If JMX requires authentication, obtain the username and password of the Jetty administrator. The
username and password are required for adding the application monitor.
•
Add the hosts where Jetty is deployed to the IMC platform so APM can obtain and display network
connections of the hosts and their access devices in the application topology. For more information
about adding hosts to the IMC Platform, see H3C IMC Base Platform Administrator Guide.
To add a Jetty application monitor:
1.
Click the Resource tab.
2.
Enter the Add Application page in one of the following ways:
{
From the navigation tree, select Application Manager > Add Application.
{
From the navigation tree, select Application Manager > Application Monitor. In the application
monitor list, click Add.