Cpu usage ratio, Figure 90 – H3C Technologies H3C Intelligent Management Center User Manual
Page 157
143
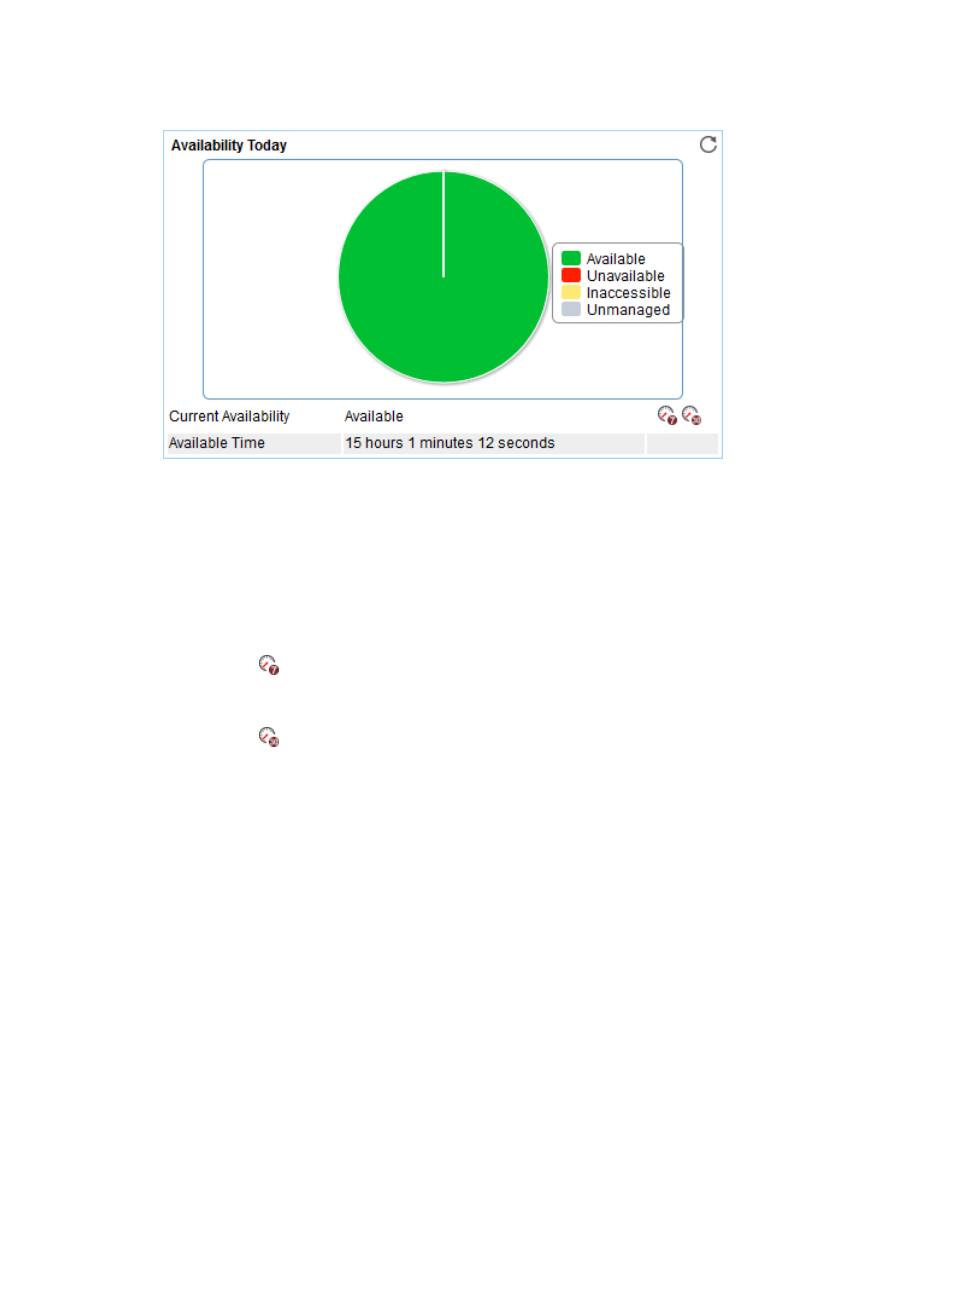
Figure 90 Availability Today area layout
Availability Today area fields:
•
Availability pie chart—Shows time duration percentages of the availability states
for the FreeBSD
application today. The availability states include Available, Unavailable, Inaccessible, and
Unmanaged. To view the time duration percentage of a specific availability state, point to the
corresponding slice in the chart.
•
Current Availability—Availability of the FreeBSD application in the last polling period.
{
To view the availability of the FreeBSD application in the last 7 days, click the Weekly History
icon
. The weekly availability data is collected hourly. To view the time duration percentages
of availability states at a specific time, point to that time.
{
To view the availability of the FreeBSD application in the last 30 days, click the Monthly History
icon
. The monthly availability data is collected daily. To view the time duration percentages
of availability states on a specific day, point to that day.
•
Available Time—Total available time duration of the FreeBSD application since 00:00 today.
•
Unavailable Time—Total unavailable time duration of the FreeBSD application since 00:00 today.
•
Inaccessible Time—Total inaccessible time duration of the FreeBSD application since 00:00 today.
•
Unmanaged Time—Total unmanaged time duration of the FreeBSD application since 00:00 today.
Availability time statistics of a new application monitor are collected since the application monitor was
added. An availability time field does not appear if its value is 0.
CPU Usage Ratio
The CPU Usage Ratio area layout is shown in a dashboard (see
).