Buffer management – H3C Technologies H3C Intelligent Management Center User Manual
Page 249
235
yesterday, this week, this month, and this year by clicking the corresponding icons on the upper
right of the graph.
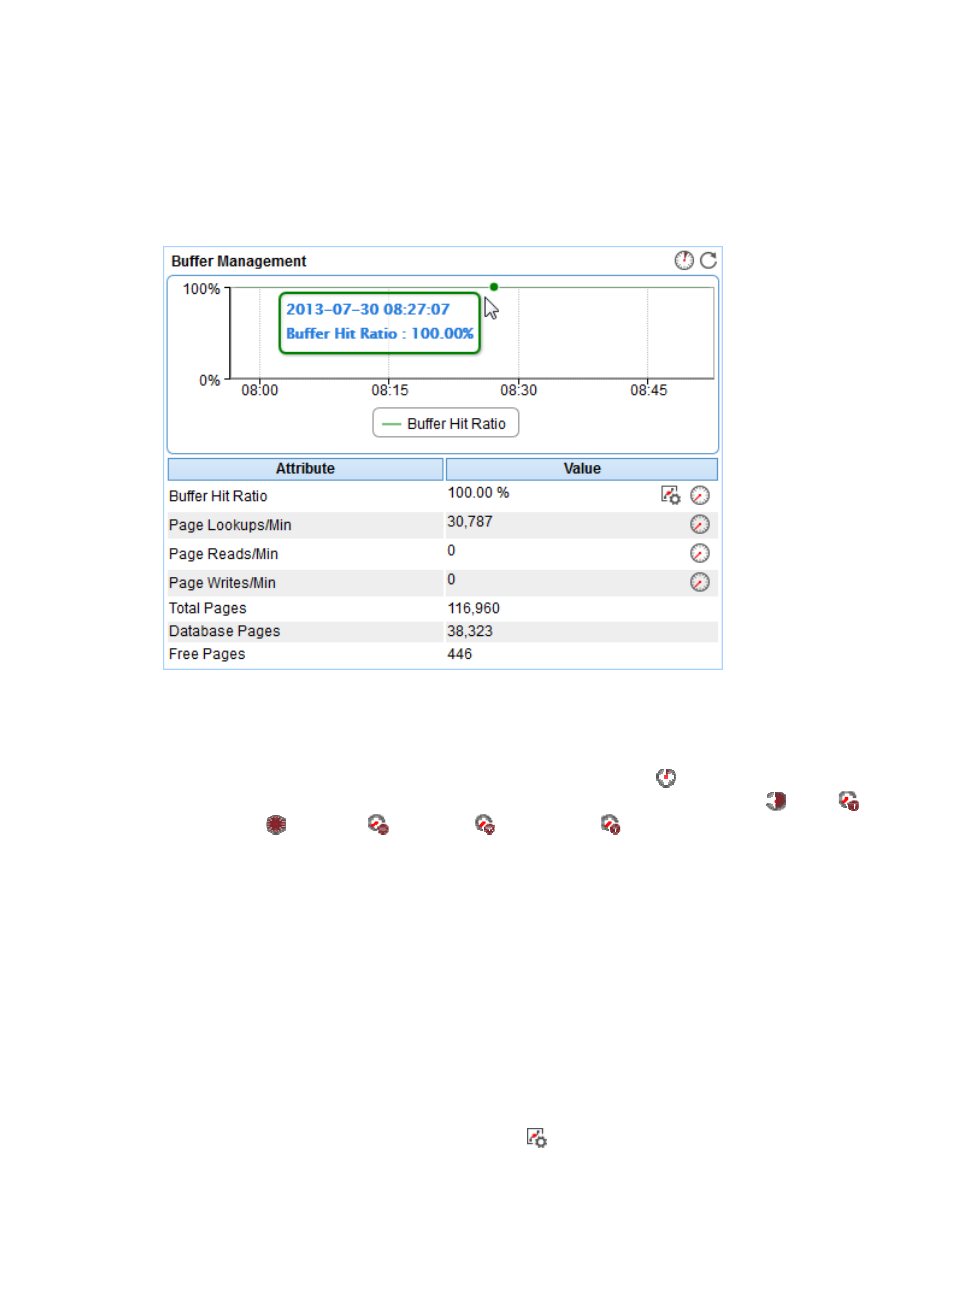
Buffer Management
The Buffer Management area layout is shown in
Figure 185 Buffer Management area layout
Buffer Management area fields:
•
Buffer Hit Ratio trend graph—Shows the buffer hit ratio trend of the SQL Server over the last 1 hour
in a line chart. Point to a spot on the curve to view the buffer hit ratio of SQL Server at the specific
time point. To change the report period, click the Last 1 Hour icon
on the upper right of the
graph, and then select an icon from the list. Available options include Last 6 Hours
, Today
,
Yesterday
, This Week
, This Month
, and This Year
.
•
Attribute/Value—Monitor index name and data that was obtained when APM last polled the SQL
Server.
{
Buffer Hit Ratio—How often the required pages have been found in the buffer pool without
reading from the disk.
{
Page Lookups/Min—Number of requests to search for pages in the buffer pool per minute.
{
Page Reads/Min—Number of database pages that were read from the disk per minute.
{
Page Writes/Min—Number of database pages that were written to the disk per minute.
{
Total Pages—Total number of the pages in the SQL Server buffer, including stolen pages,
available pages, and database pages.
{
Database Pages—Number of database pages in the buffer pool.
{
Free Pages—Available pages in the buffer pool.
{
Set Threshold—Click the Set Threshold icon
to set alarm thresholds for the buffer hit ratio.
The specified alarm thresholds appear on the Buffer Hit Ratio trend graph as dotted lines. The
data is highlighted in orange when the buffer hit ratio reaches the level-1 threshold, and is