Background processing terminations – H3C Technologies H3C Intelligent Management Center User Manual
Page 639
625
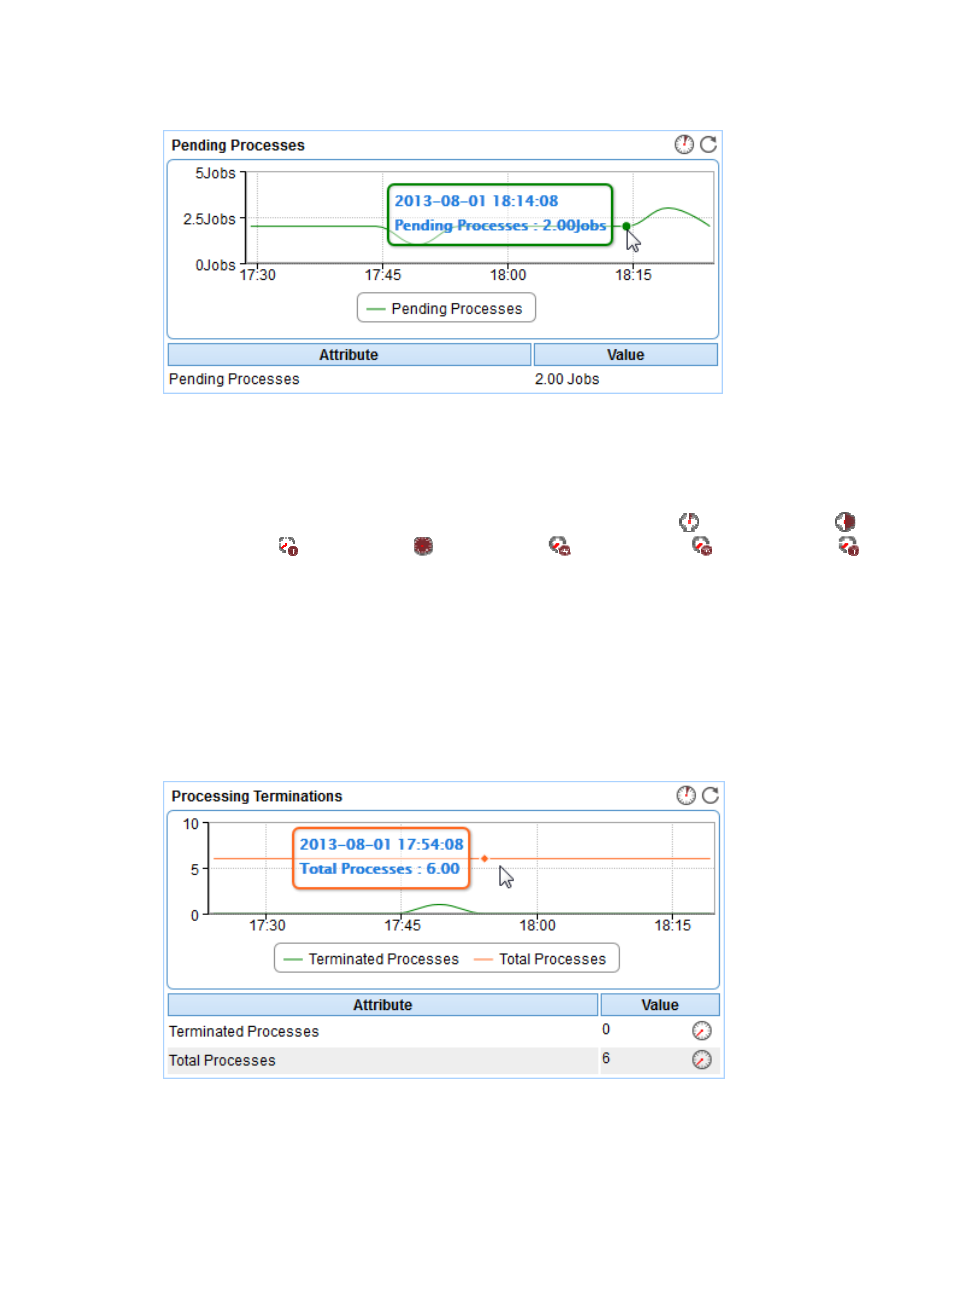
Figure 527 Pending Background Processes area layout
Pending Background Processes area fields:
•
Trend graph—Shows the changes in the number of pending background processes for the SAP
application in a line chart. Point to a spot on the curve to view the number of pending background
processes at the specific time point. View the changes in the number of pending background
processes over a specific time period by clicking the Last 1 Hour icon
, Last 6 Hours icon
,
Today icon
, Yesterday icon
, This Week icon
, This Month icon
, or This Year icon
.
The graph shows the last hour data by default.
•
Attribute/Value—Monitor index name and data.
{
Pending Background Processes—Number of pending background processes in the SAP
application when it was last polled by APM.
Background Processing Terminations
The Background Processing Terminations area is located on the Background tab and its layout is shown
in
.
Figure 528 Background Processing Terminations area layout
Background Processing Terminations area fields:
•
Trend graph—Shows the changes in the numbers of terminated and total background processes of
the SAP application in a line chart. The green curve shows the number of terminated SAP