Response time, Thread pool – H3C Technologies H3C Intelligent Management Center User Manual
Page 389
375
•
Inaccessible Time—Total inaccessible time duration of the WebSphere server since 00:00 today.
•
Unmanaged Time—Total unmanaged time duration of the WebSphere server since 00:00 today.
Availability time statistics of a new application monitor are collected since 00:00 on the day when the
application monitor was added. An availability time field does not appear if its value is 0.
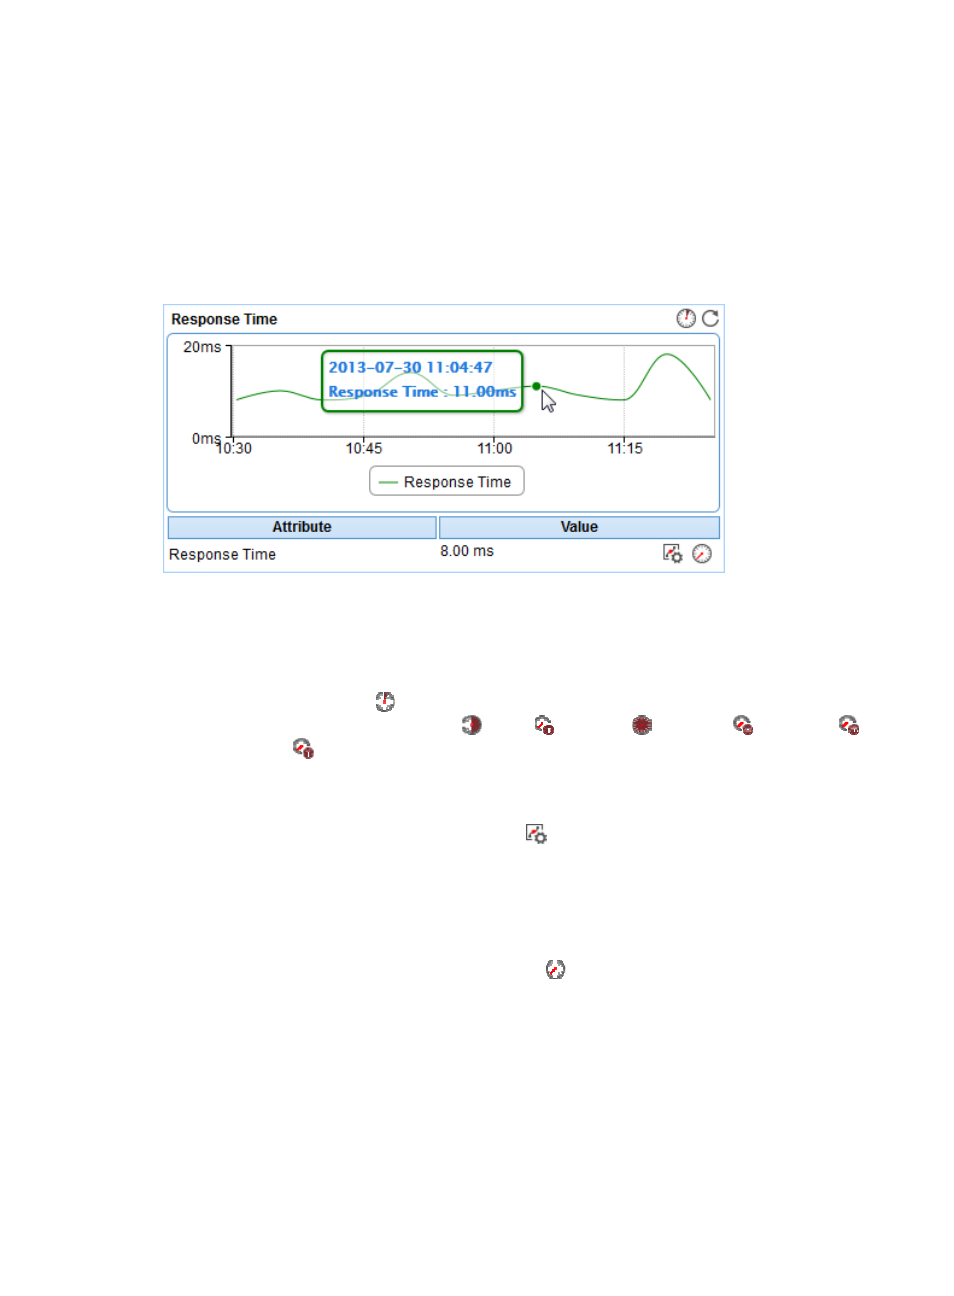
Response Time
The Response Time area layout is shown in
.
Figure 315 Response Time area layout
Response Time area fields:
•
Response time trend graph—Shows changes of the response time of the WebSphere server over
the selected time period in a line graph. Point to a spot in the curve to view the response time at the
specific time point. By default, the graph shows the last 1 hour data. To change the report period,
click the Last 1 Hour icon
on the upper right of the graph, and then select an icon from the list.
Available options include Last 6 Hours
, Today
, Yesterday
, This Week
, This Month
,
and This Year
.
•
Attribute/Value—Monitor index name and data.
{
Response Time—Round-trip response time of the WebSphere server in the last polling interval.
{
Set Threshold—Click the Set Threshold icon
to set alarm thresholds for the server response
time. The specified alarm thresholds appear on the response time trend graph as dotted lines.
The data is highlighted in yellow when the response time reaches the level-1 threshold, and is
highlighted in red when the response time reaches the level-2 threshold. Use the global
thresholds or self-defined thresholds. For information about setting the thresholds, see "
{
History Record—Click the History Record icon
to view the history graph of the response
time trend of the WebSphere server. Point to a spot on the curve to view the data at the specific
time point. Authorized users can view the statistics over the last 1 hour, last 6 hours, today,
yesterday, this week, this month, and this year by clicking the corresponding icons on the upper
right of the graph.
Thread Pool
The Thread Pool area layout is shown in